


The client
The client is a large retail chain in India with stores, warehouses and regional operational facilities.
Every site uses electricity, water and other utilities, and together they are a significant operating cost. The business wanted to know where that money went and which sites used more than they should.
The challenge
Usage records existed, but each location kept its own, so nobody could see consumption across the chain or spot unusually high usage quickly.
- Utility information held separately at each location.
- Consolidated monitoring across sites was difficult.
- Unusually high usage was hard to identify.
- Corrective action could not be prioritized without data.
- Utility reports were consolidated by hand.
What they set up in Asset Infinity
The chain centralized utility readings and consumption monitoring in Asset Infinity across its retail locations.
Utility meters by site
Each store, warehouse and facility has its electricity, water and other utility meters set up in the system. (Energy)
Structured readings
Facility teams record meter readings on a regular schedule from the web or mobile app, in the same format at every site. (Energy)
Consumption by location
Consumption is calculated per meter and site, so usage can be compared across locations and over time. (Energy)
Central dashboards
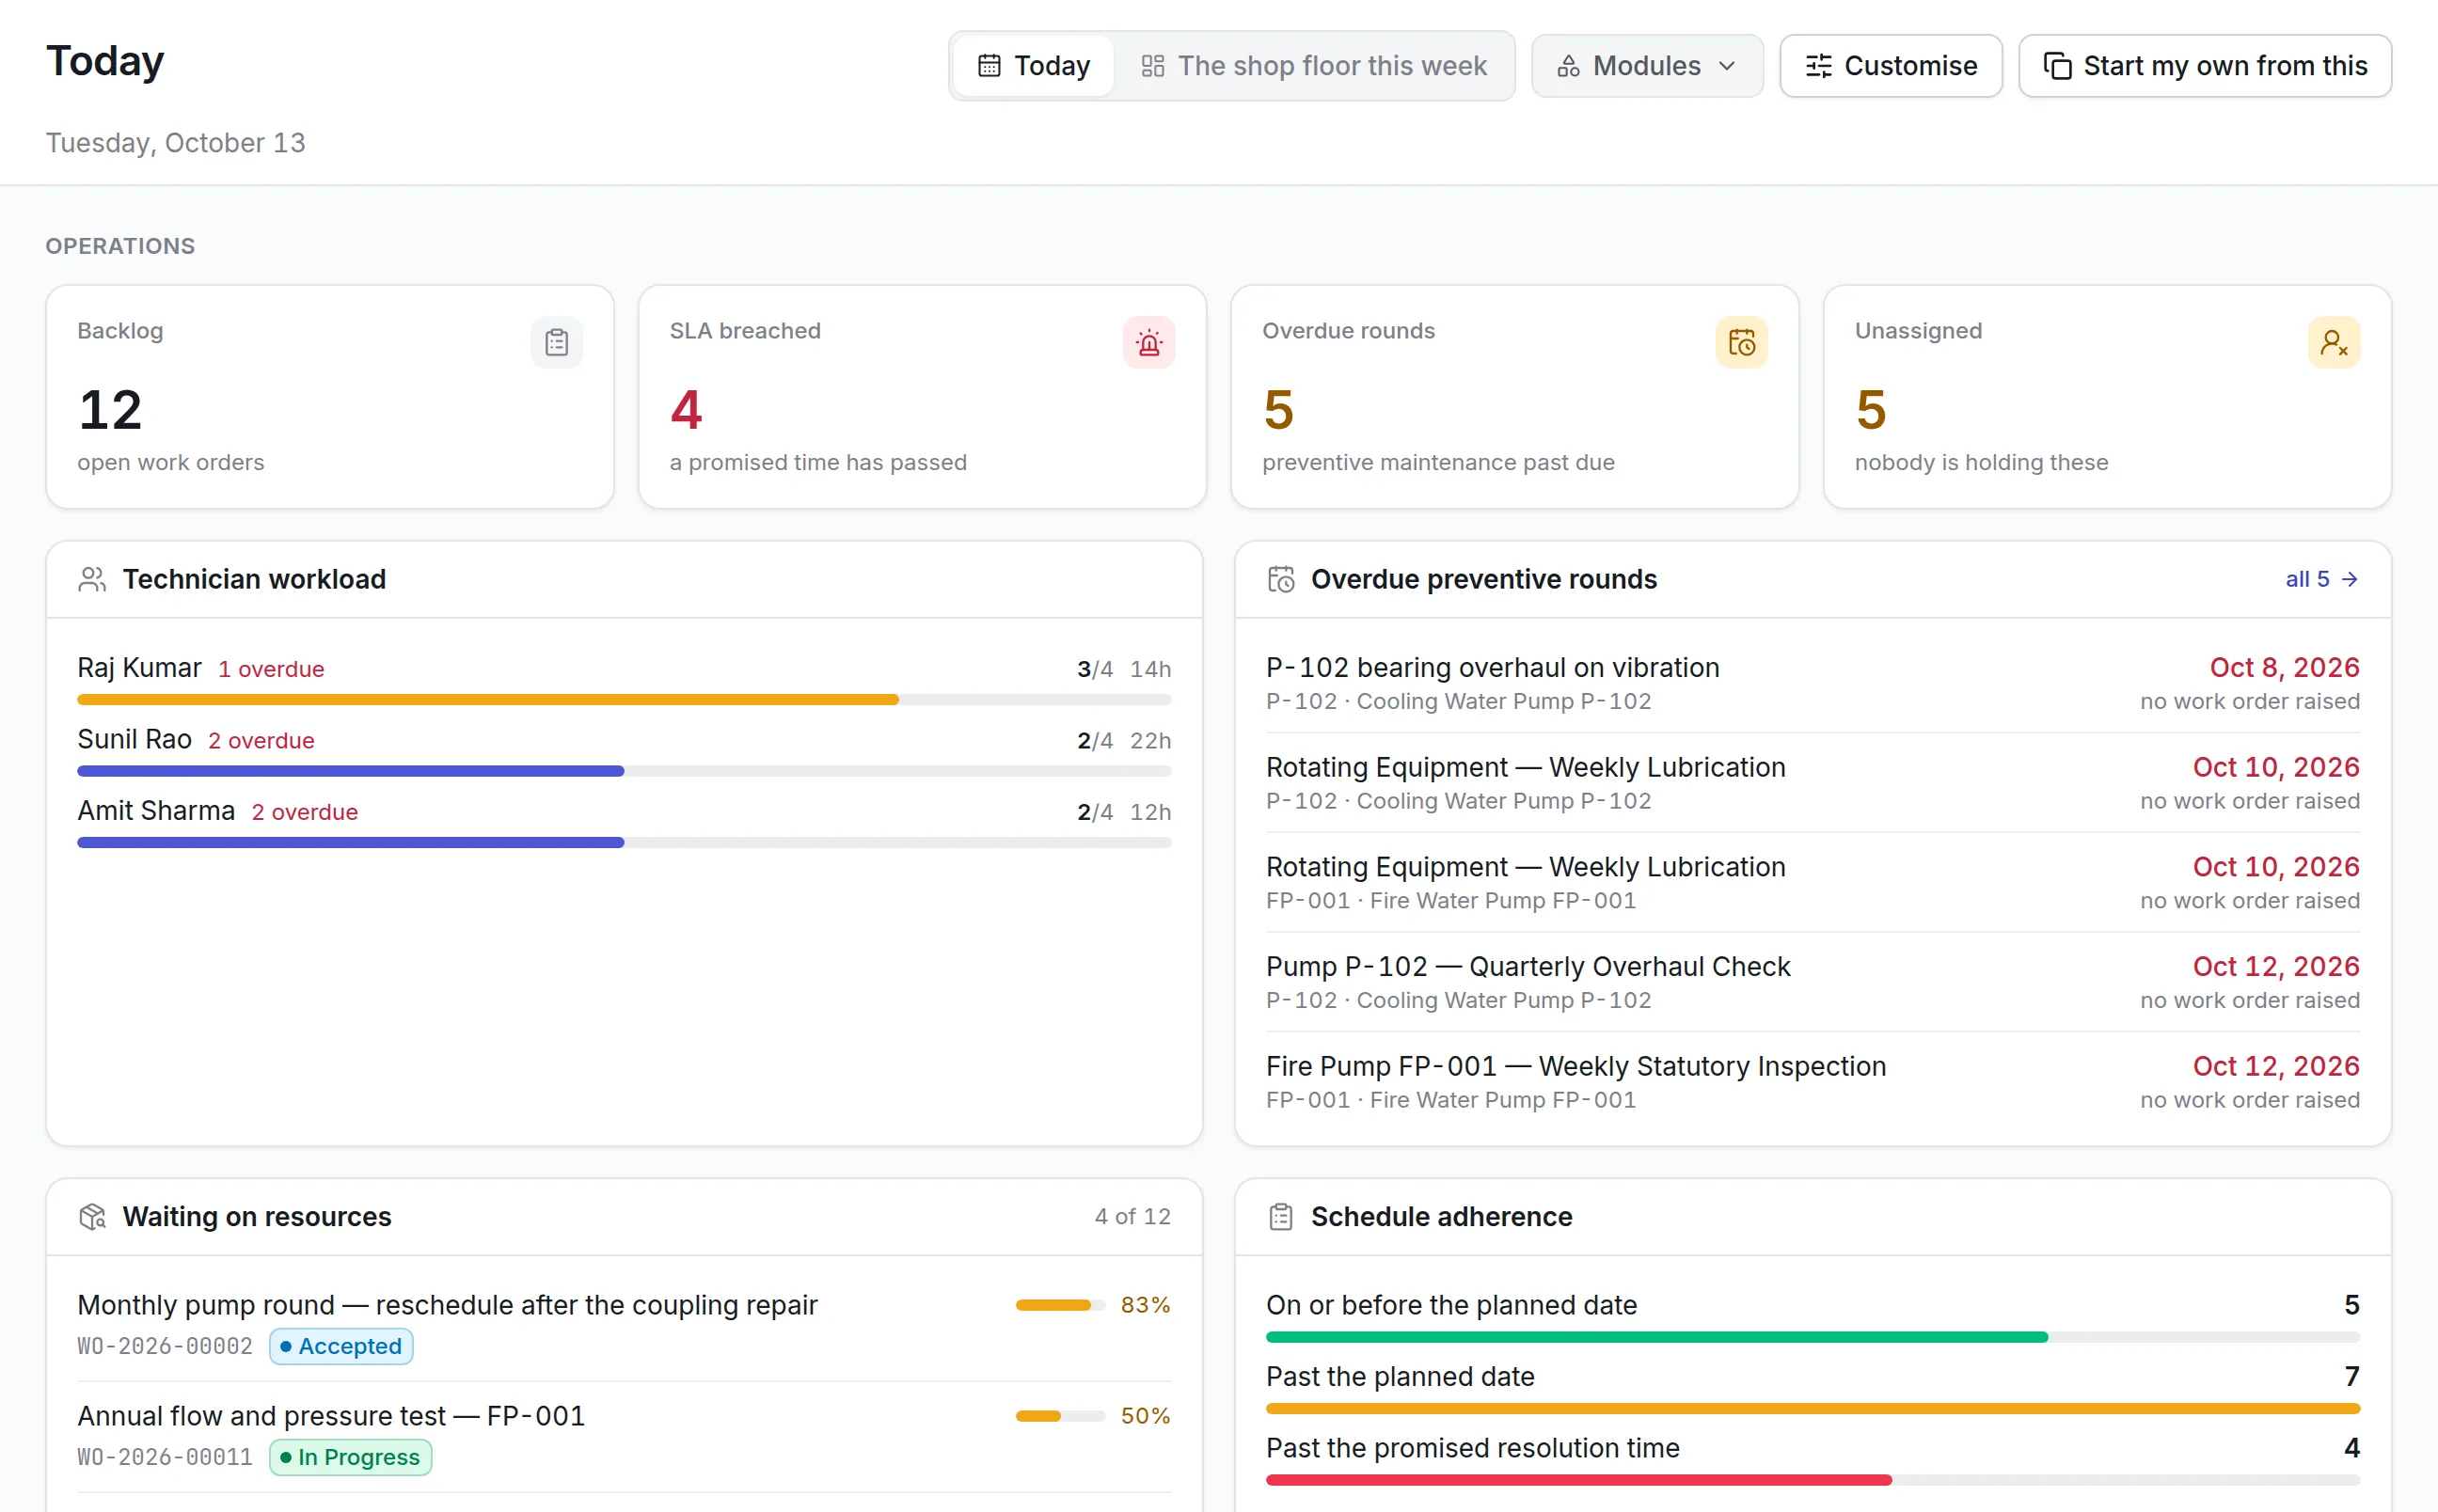
Dashboards and reports show consumption across the chain and highlight high-usage locations and changing patterns. (Insight)
How it works day to day
Here is how utility use is tracked across the chain now.
- Facility staff: take meter readings. On schedule, staff at each site record electricity, water and other meter readings in the mobile app.
- System: calculates consumption. Each reading is turned into consumption for that meter and site, ready to compare.
- Regional facility manager: compares sites. Dashboards show which stores and warehouses use the most, and how usage is changing.
- Regional facility manager: investigates high usage. A site with unusually high consumption is followed up, and a work request can be raised if equipment needs attention.
- Technician: fixes the cause. If the cause is faulty equipment, such as a failing air-conditioning unit, the technician receives a work order and closes it once the fault is repaired.
- Head office: reviews the chain. Scheduled reports summarize consumption across all locations, without consolidating spreadsheets by hand.
Before and after
| Before | With Asset Infinity | |
|---|---|---|
| Utility records | Kept separately at each location | One place for all sites |
| Monitoring | Consolidated view was difficult | Central dashboards |
| High usage | Hard to identify | High-consumption sites stand out |
| Corrective action | Hard to prioritize | Based on location-level data |
| Reporting | Manual consolidation | Reports from structured readings |
How it rolled out
- Utilities reviewed. Locations, utility types, consumption records and reporting practices were reviewed.
- Sites and meters configured. Stores, warehouses and facilities were set up, and utility services and readings mapped to each.
- Teams trained, monitoring refined. Facility teams were trained, and monitoring refined as consumption patterns were reviewed.
The results
- Consolidated utility consumption across stores, warehouses and facilities
- High-consumption locations and changing usage patterns identified
- Clearer consumption data supporting cost-reduction efforts
- Less manual consolidation of utility information
- Operational decisions based on location-level consumption
Why it worked
Same readings everywhere
Structured reading capture meant every site’s data could be compared directly.
Every site covered
Stores, warehouses and regional facilities were all set up, so the picture was complete.
Reviewed and refined
Consumption patterns were reviewed after go-live and monitoring adjusted for cost control.
Looking ahead
The retail chain moved from fragmented utility records to central consumption monitoring. Teams compare usage between sites, see patterns and act on the locations that use the most.
With less manual reporting and clearer data, utility cost control is now part of how the chain runs its stores, warehouses and facilities.