


The client
The client is a large retail chain with more than 200 outlets across the country.
Each outlet runs on store equipment, fixtures, checkout hardware and other assets. When one of them is down or sits unused, the store loses sales time and the business pays for repairs or replacements it could have avoided.
The challenge
Assets were tracked by hand, and store teams and head office had no shared picture of what was in use, what was idle and what was about to fail.
- No real-time view of how store assets were being used across outlets.
- Equipment failed without warning and disrupted store operations.
- Communication gaps between stores and maintenance slowed repairs.
- Decisions on servicing and replacing assets were made without usage data.
- Unnecessary replacements and repairs added avoidable cost.
What they set up in Asset Infinity
The chain moved its store assets, servicing and fault reporting into Asset Infinity, set up around the way its outlets already work.
One register for every outlet
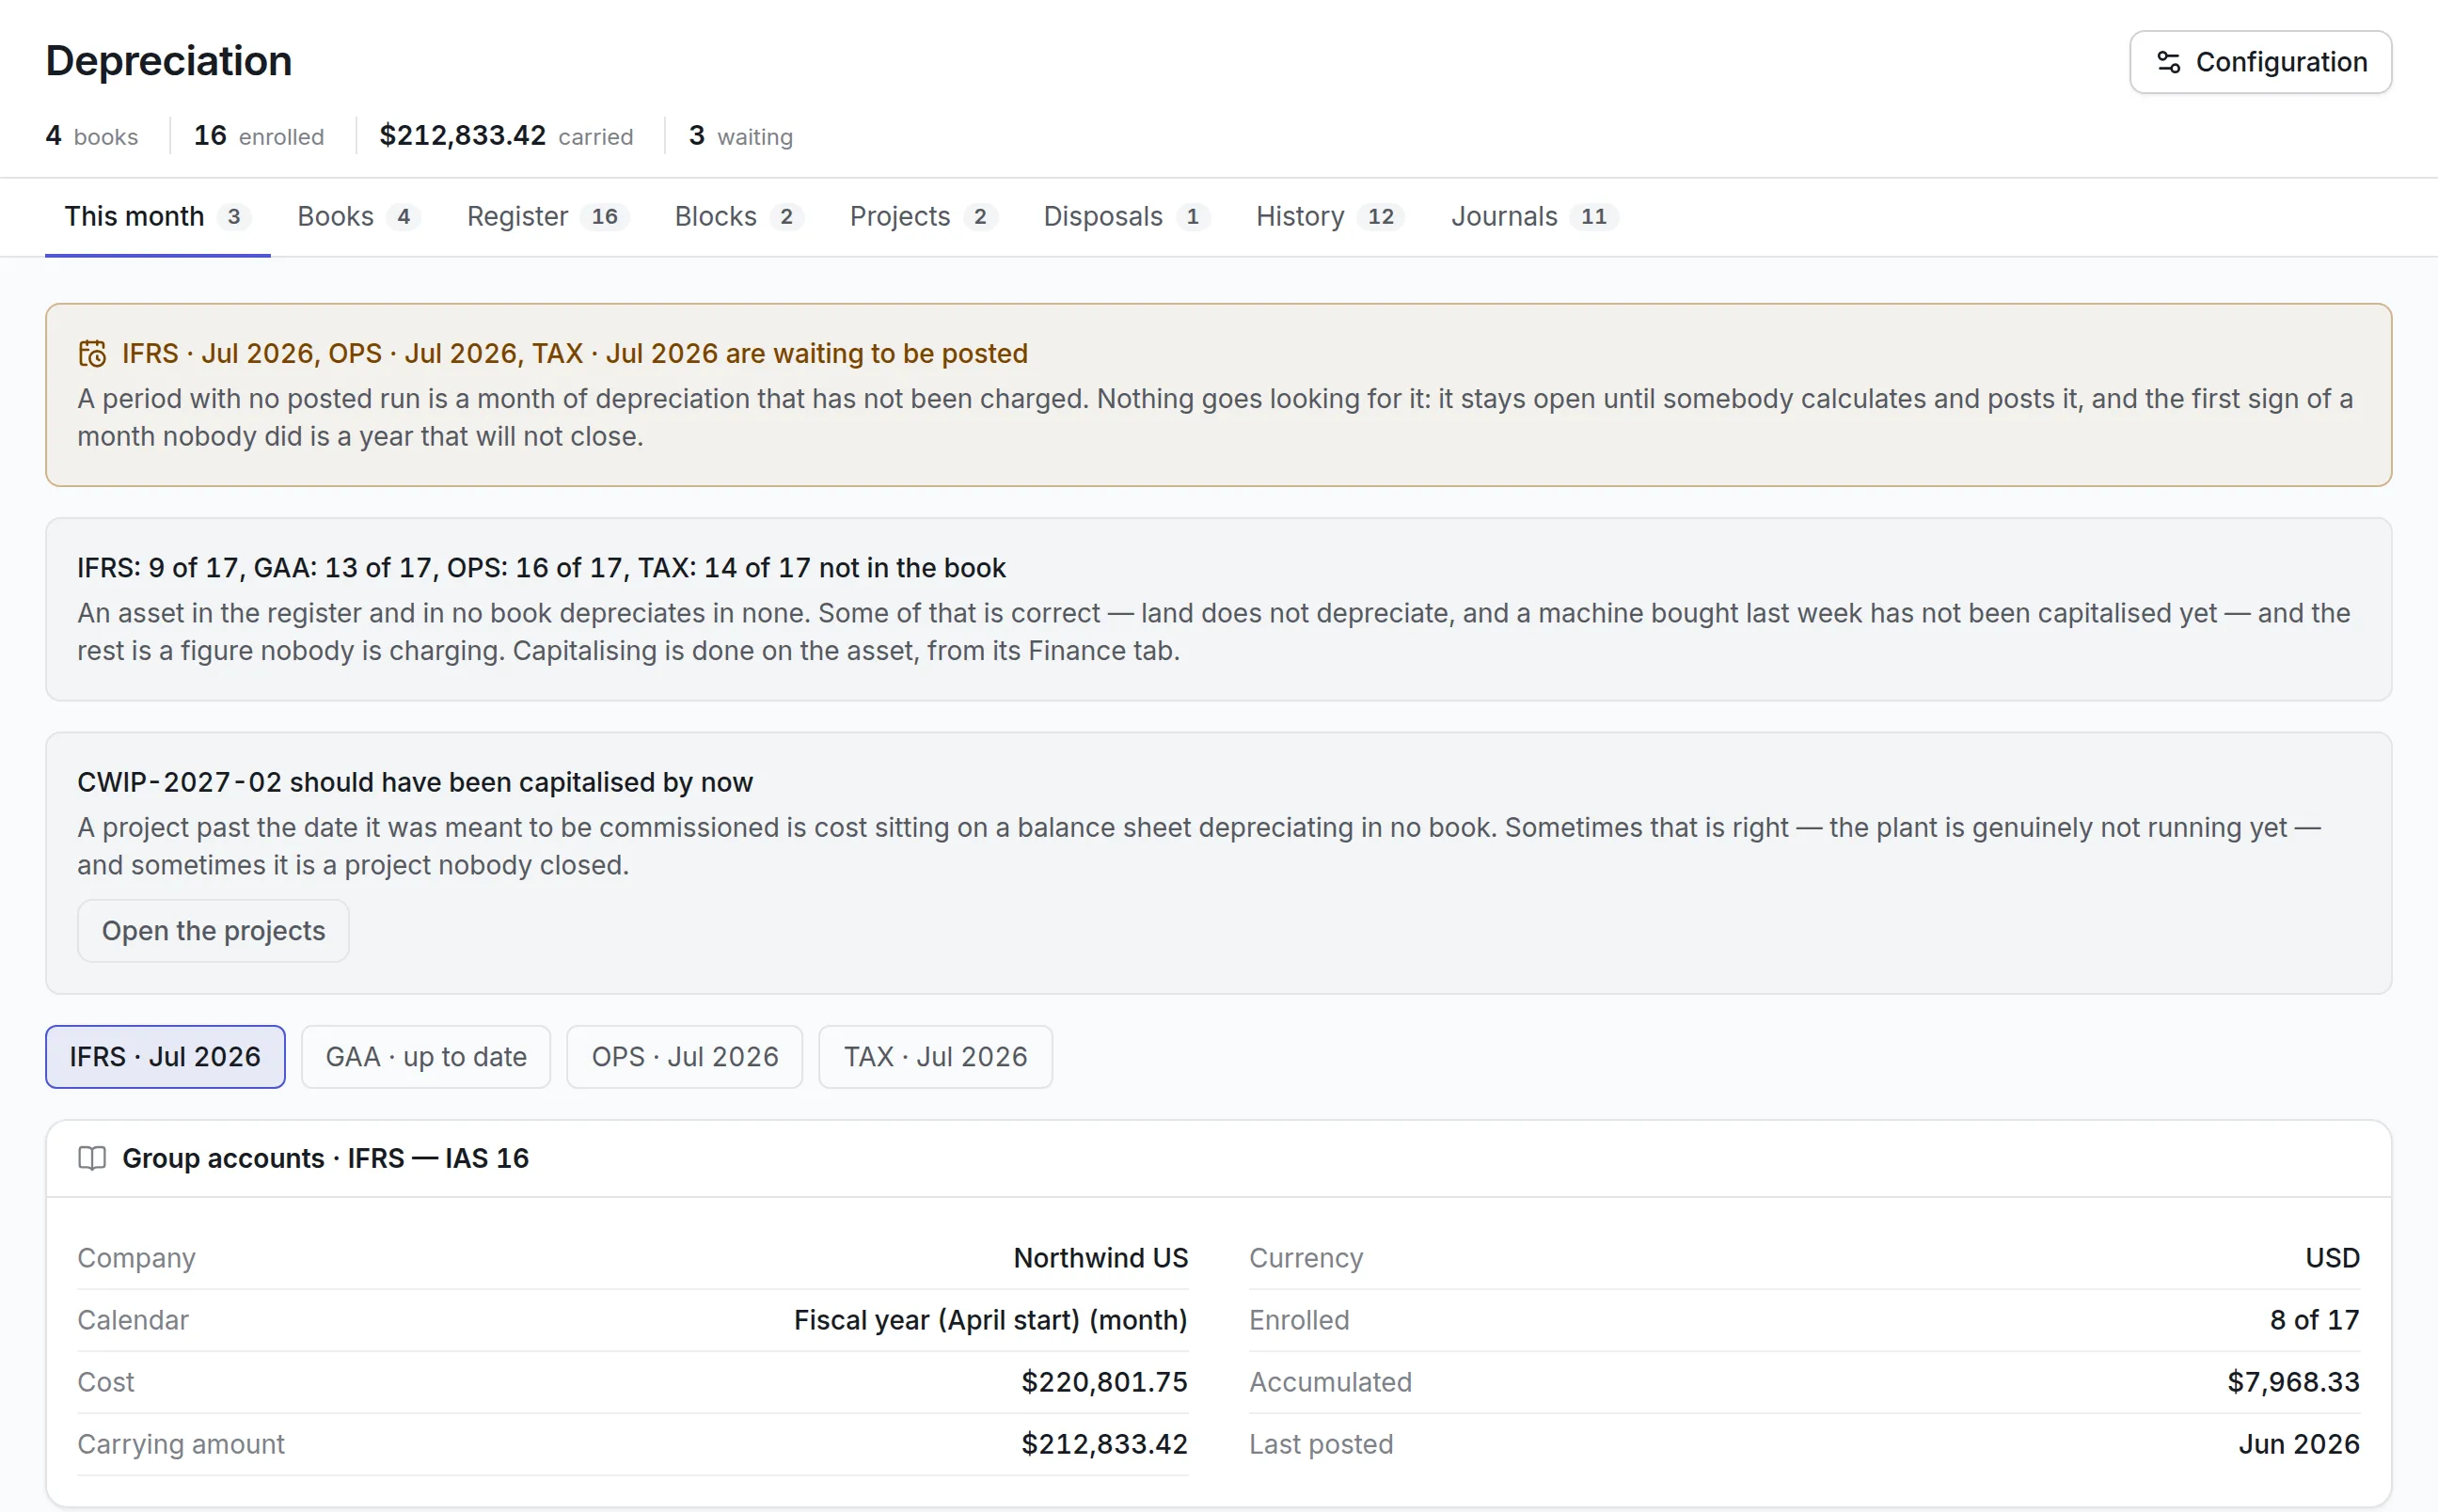
Equipment, fixtures and checkout hardware are recorded per outlet, with status and location, so head office can see what each store has and what is available. (Assets)
Servicing based on usage
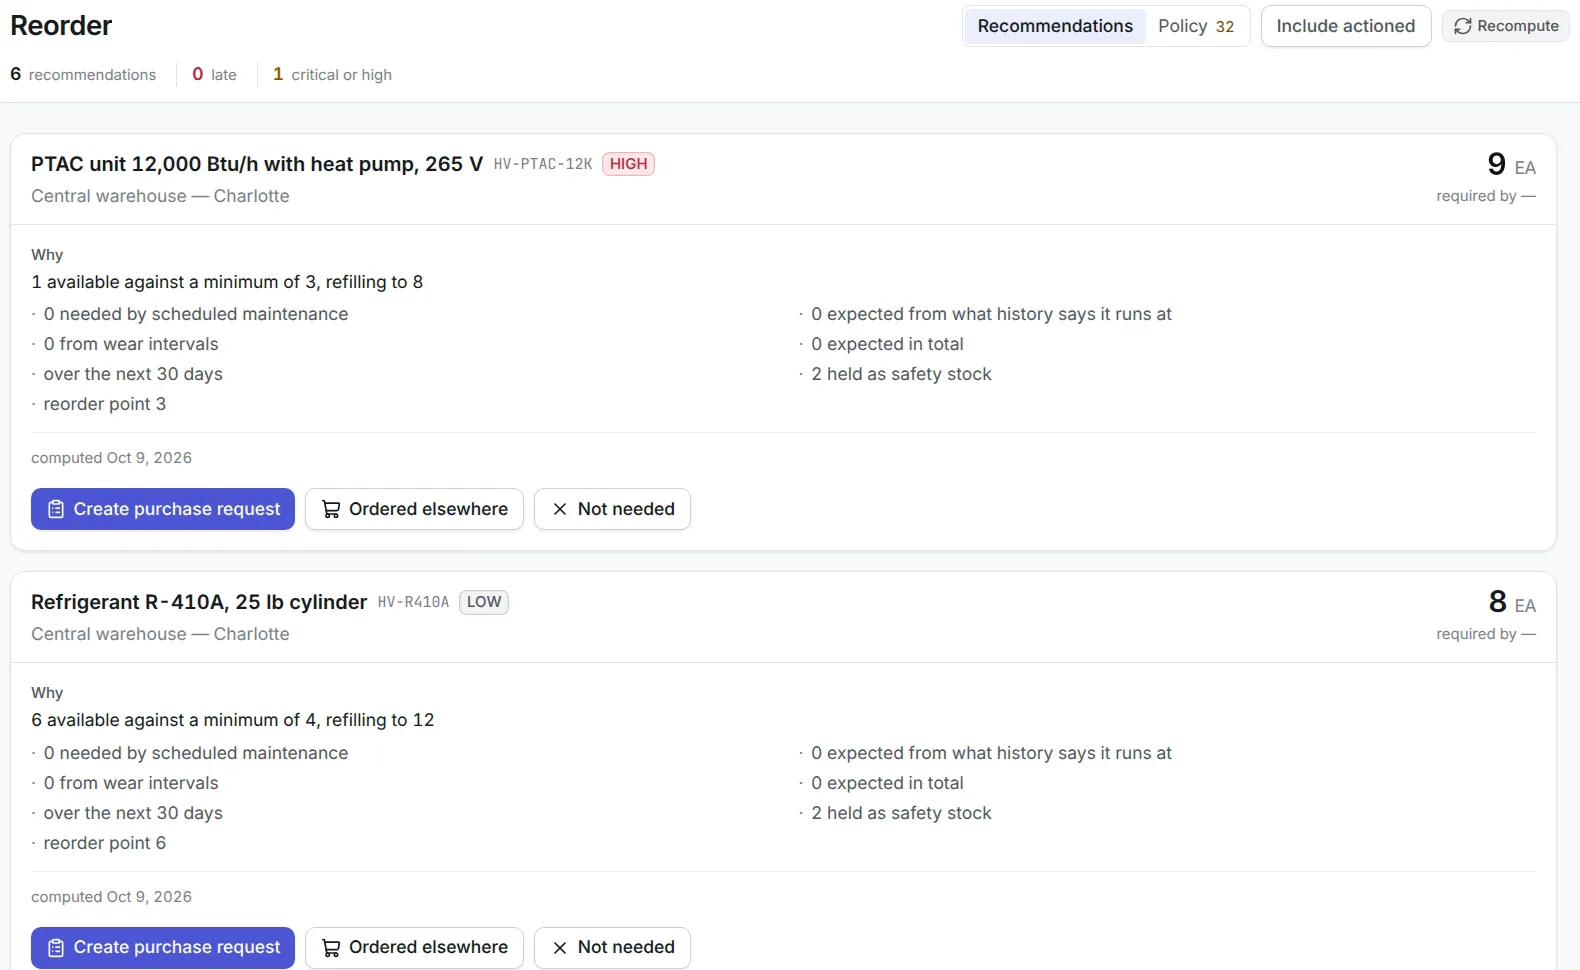
Preventive plans run by date, meter or runtime, so busy equipment is serviced before it fails and lightly used equipment is not serviced too early. (Maintenance)
Fault reporting from stores
Store managers report issues and request maintenance from the web or mobile app, and each request becomes a tracked work order. (Work)
Utilization dashboards
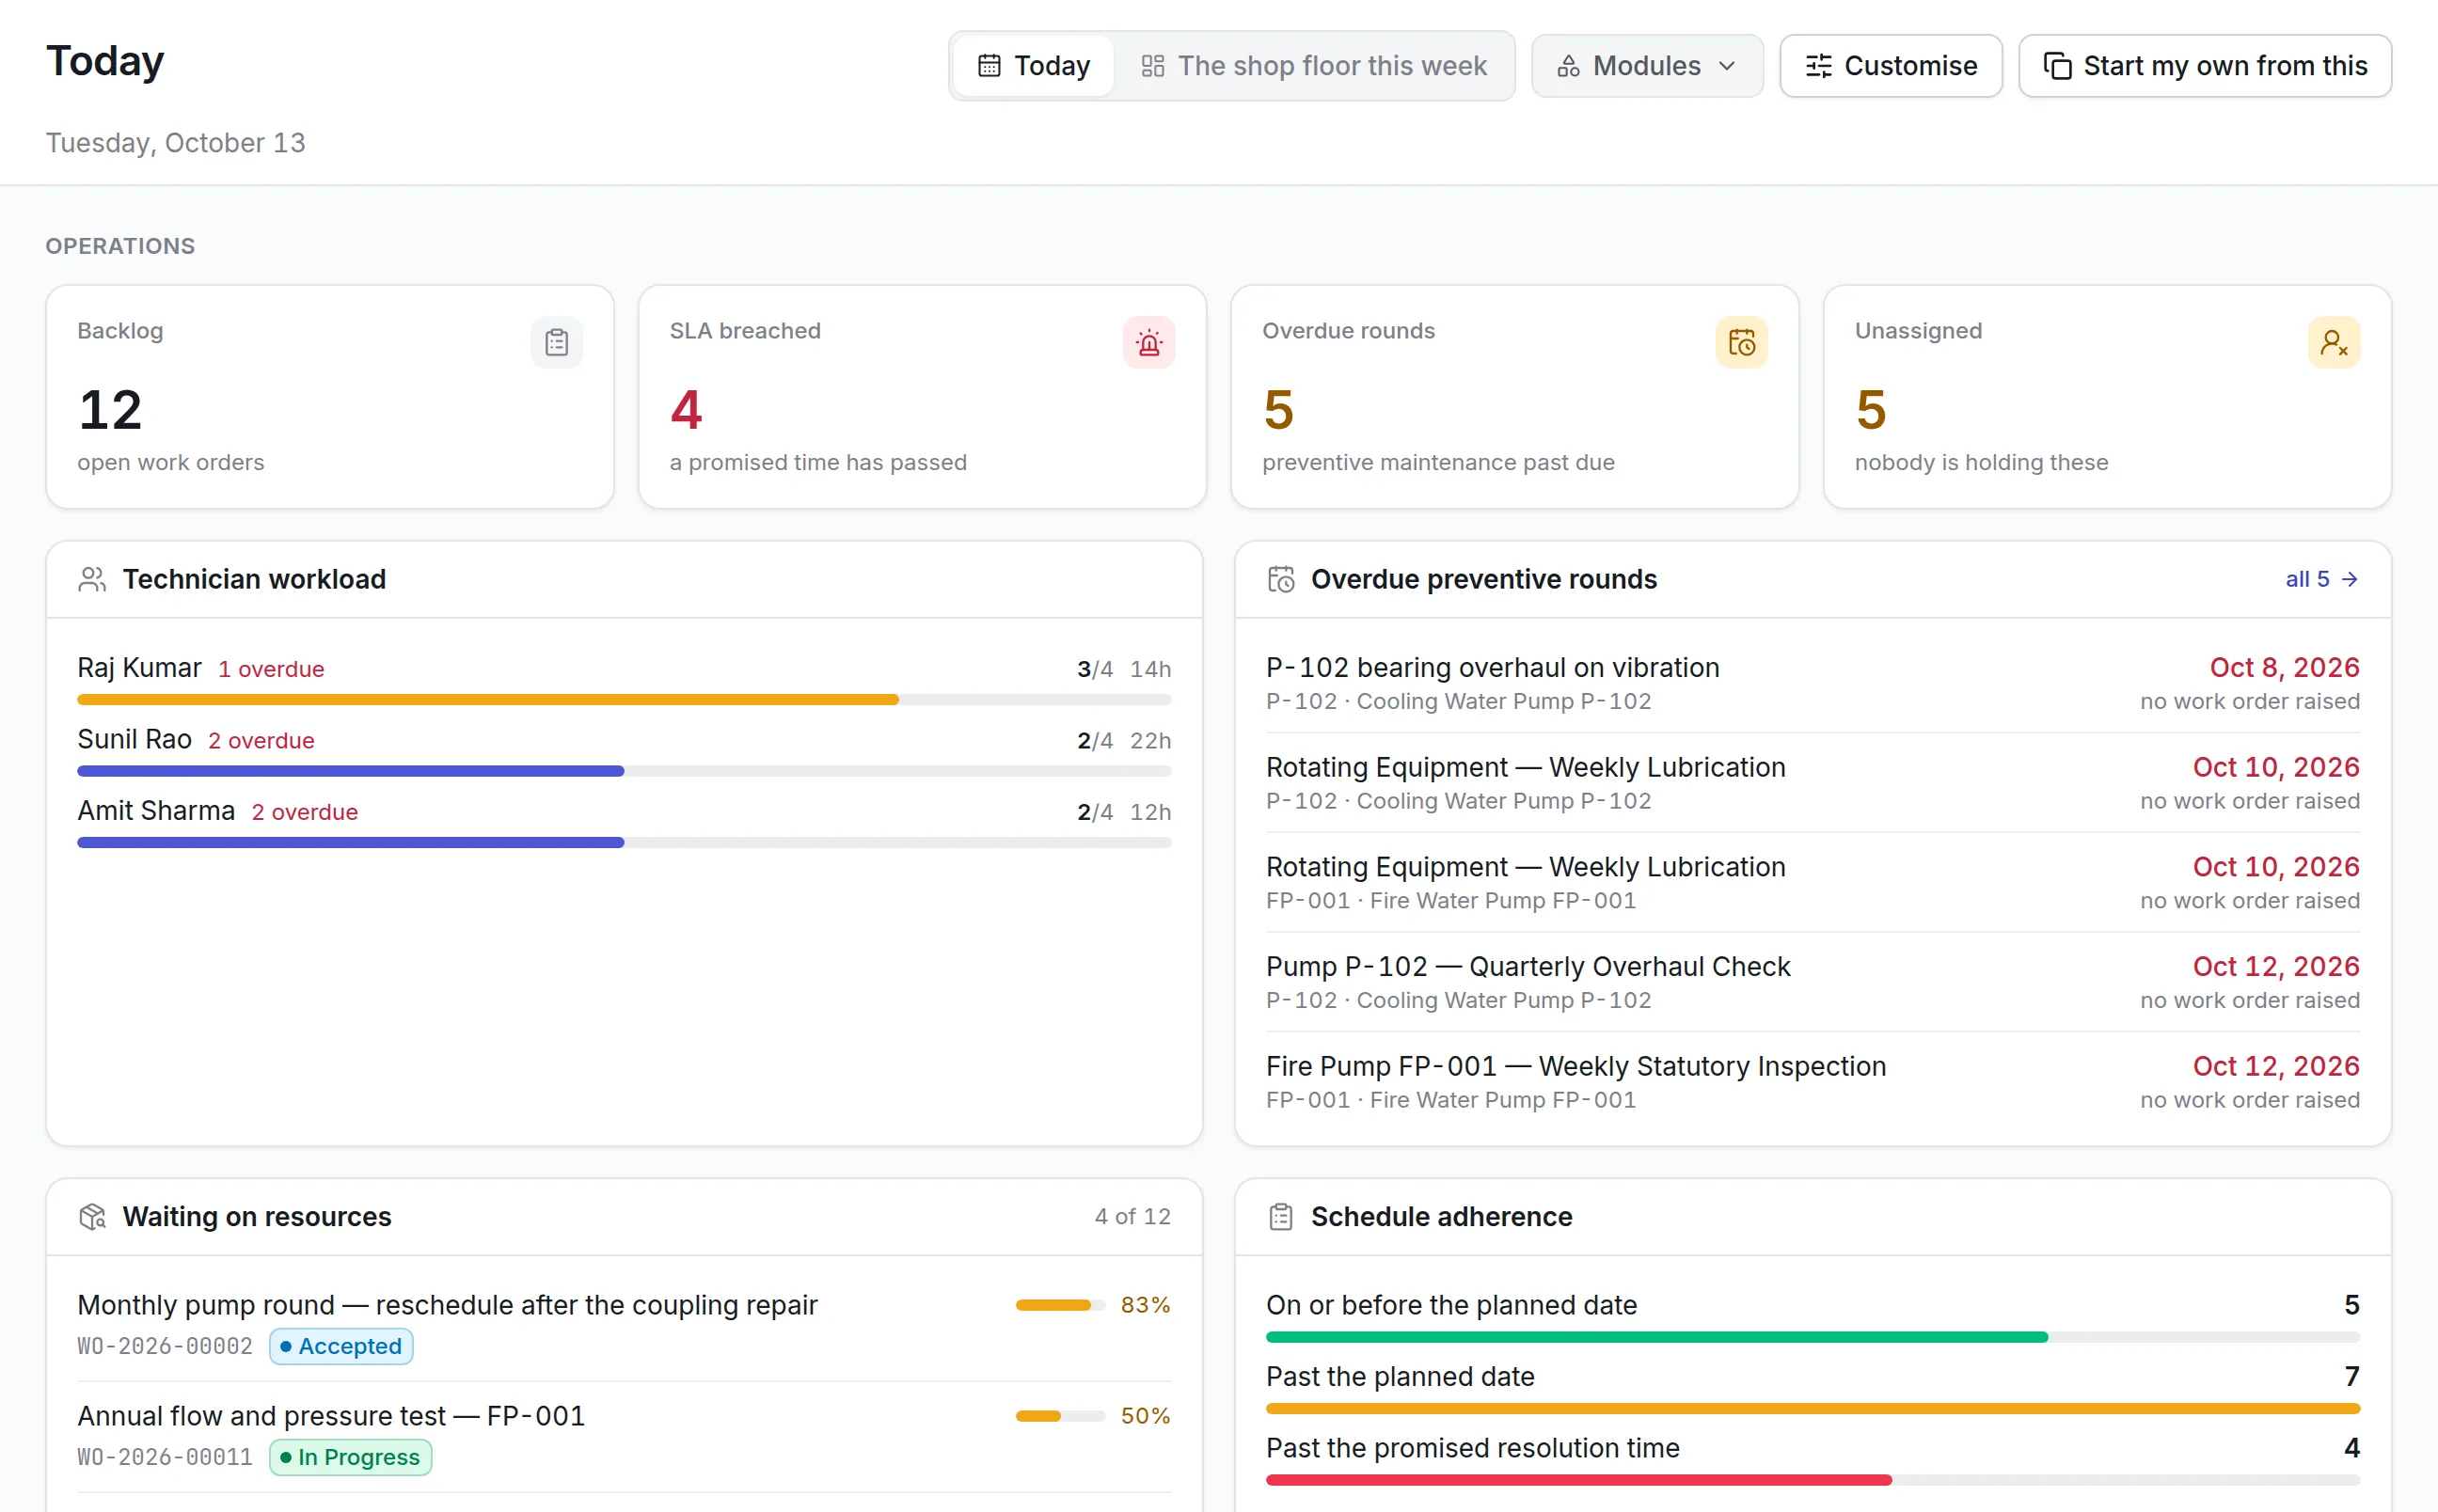
Dashboards and reports show how assets are used across outlets and where the gaps are, so decisions on servicing and replacement rest on data. (Insight)
How it works day to day
Here is how store assets are looked after across the chain now.
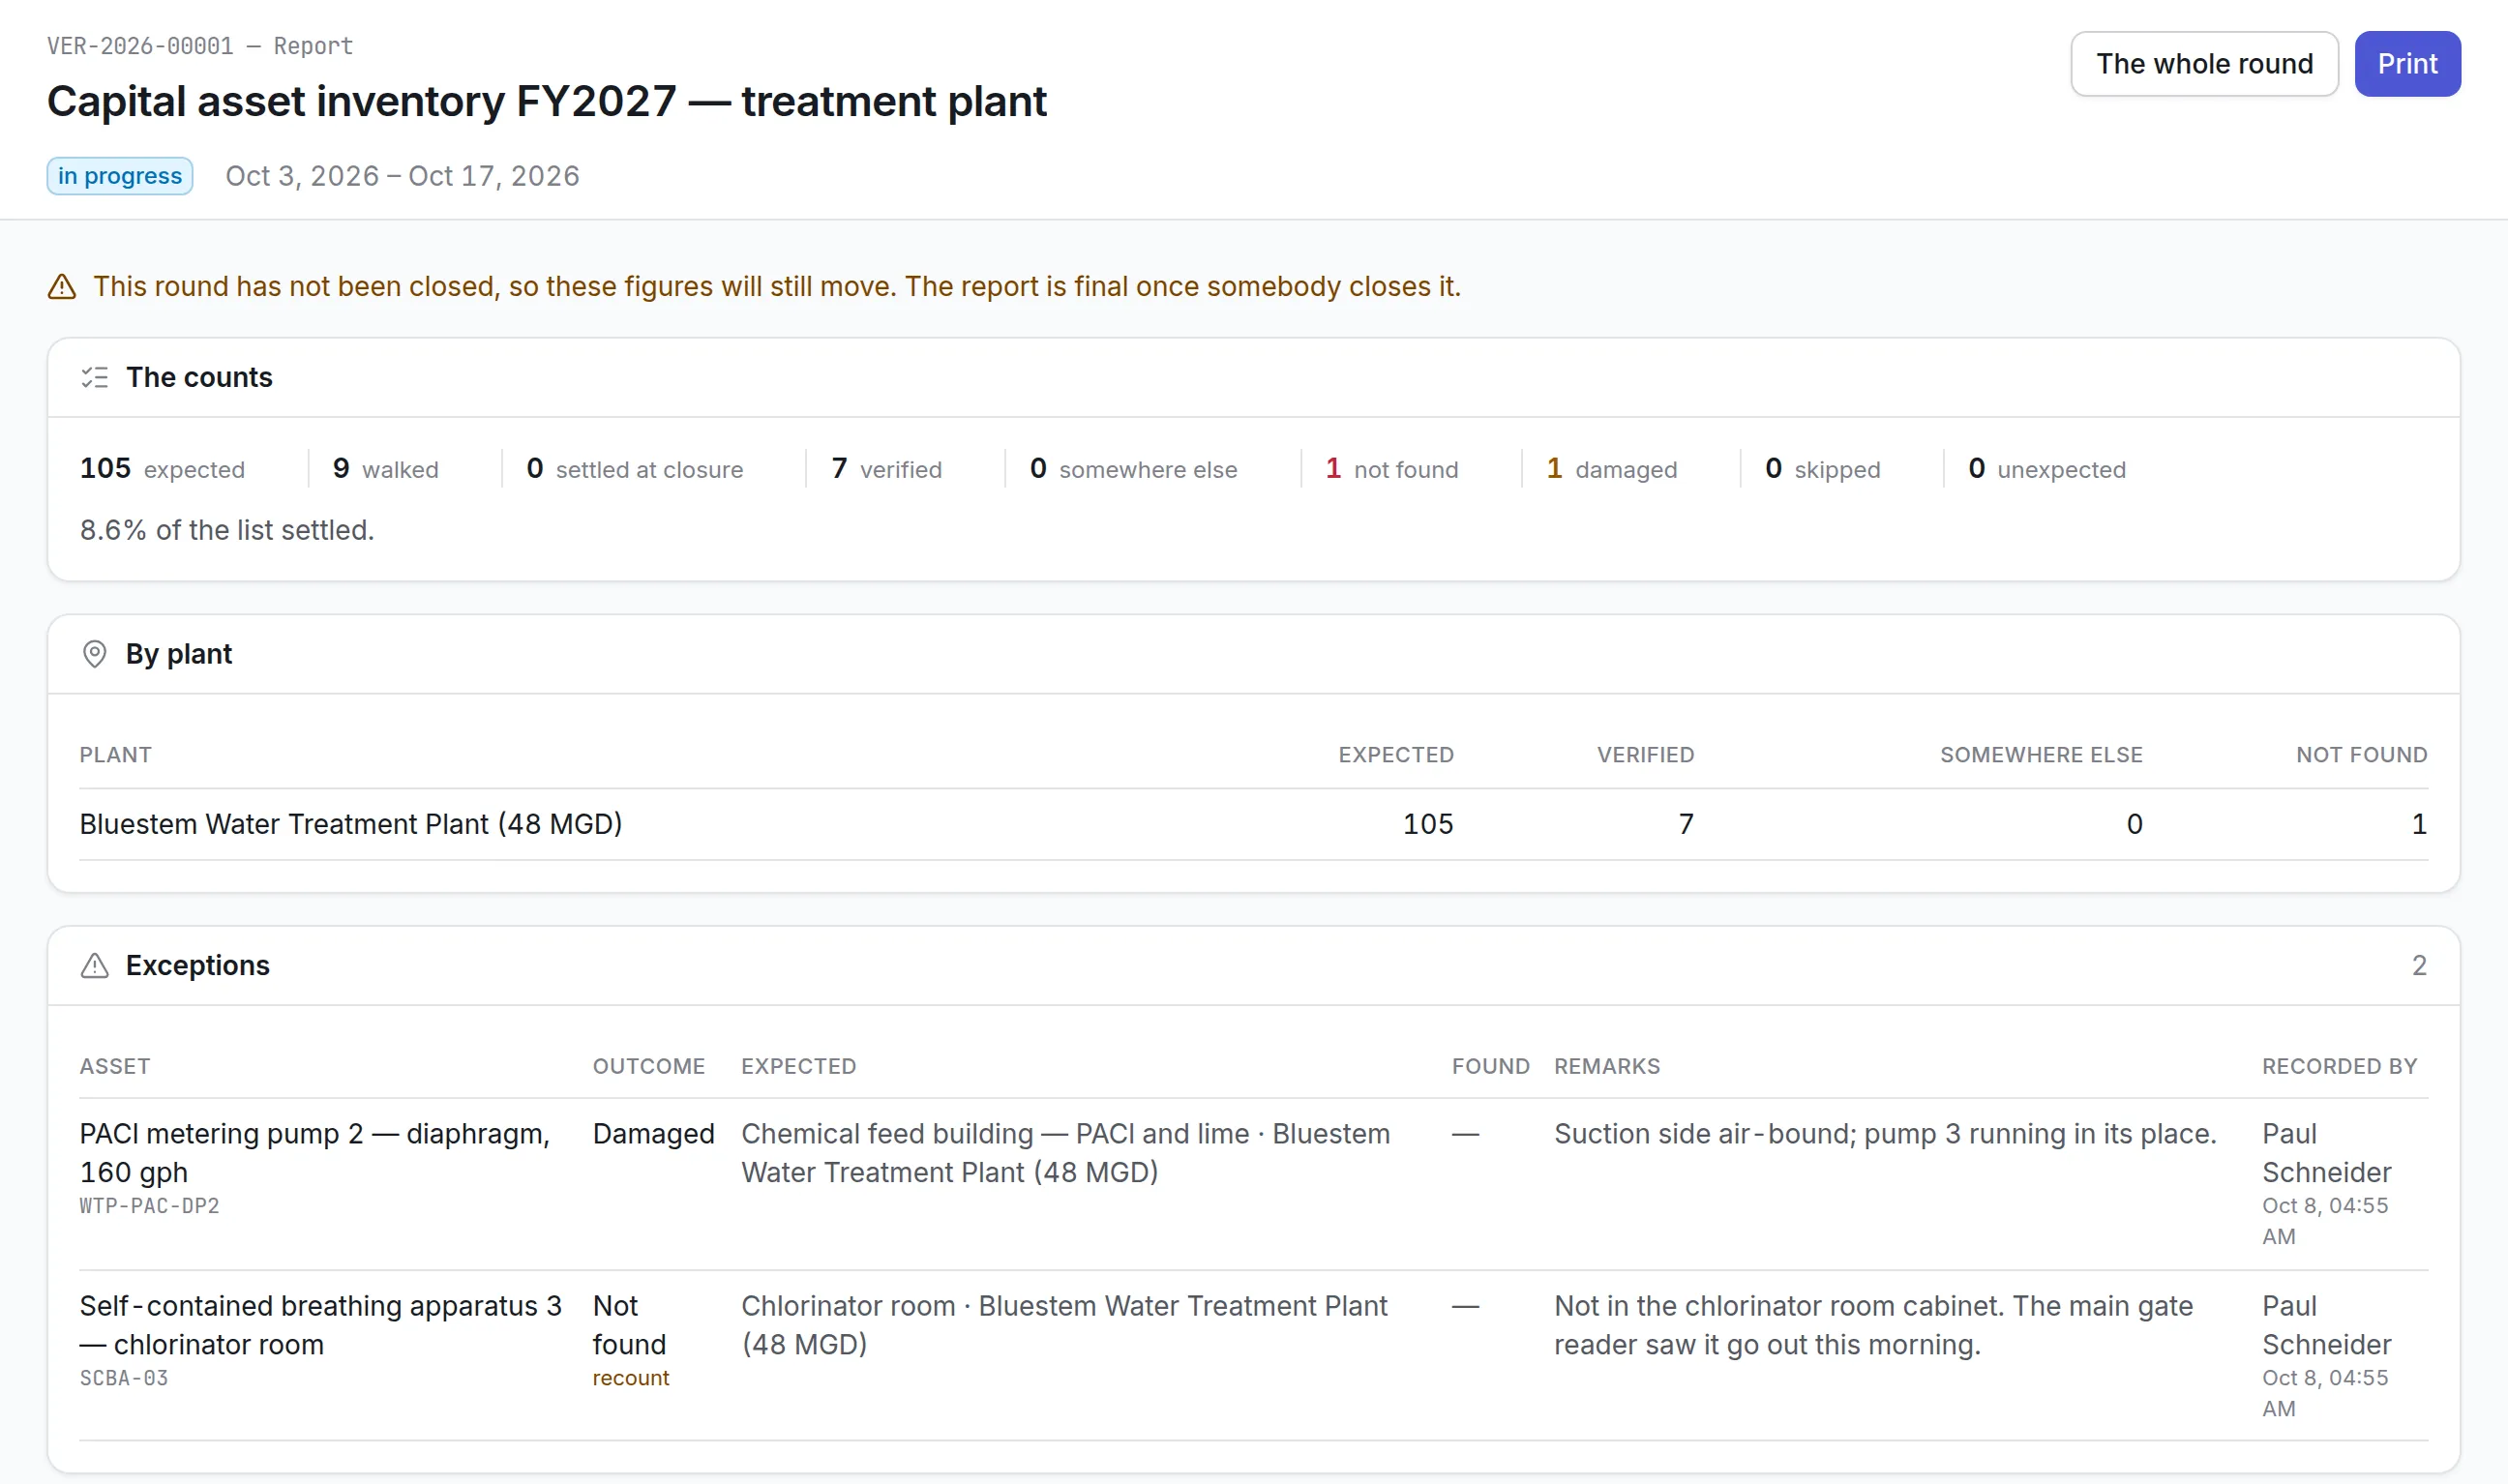
- Store manager: checks the outlet’s assets. The outlet’s equipment and fixtures are listed in the register with their status, so the manager knows what is in use and what is waiting for repair.
- Store manager: reports a fault. When something stops working, the manager raises a request from the mobile app, or by scanning the asset’s QR label, with a photo and a priority.
- Maintenance coordinator: assigns the job. The request becomes a work order and is assigned to a technician, who is notified on the mobile app.
- System: schedules servicing by usage. Preventive plans based on meter readings or runtime raise service work when an asset reaches its limit, before it breaks during trading hours.
- Technician: completes and closes the work. The technician records what was done and closes the work order, which adds to that asset’s history.
- Head office: reviews utilization. Dashboards show how assets are used across outlets, which ones are idle and which keep failing, so replacement and servicing decisions rest on data.
Before and after
| Before | With Asset Infinity | |
|---|---|---|
| Asset tracking | Manual, outlet by outlet | One register for 200+ outlets |
| Asset utilization | No real-time view | Tracked, and up by 20% |
| Servicing | Unexpected failures | Usage-based plans, 15% less downtime |
| Reporting faults | Communication gaps with maintenance | Requests from the app, tracked to closure |
| Replacements and repairs | Some were unnecessary | 5% fewer unnecessary replacements and repair costs |
How it rolled out
- Needs assessed. The chain and the Asset Infinity team reviewed utilization problems and the different workflows across store operations.
- Configured for store processes. Asset records, servicing plans and request forms were set up to match how the outlets already work.
- Outlets brought online. Store managers began tracking assets and raising requests, and maintenance moved to usage-based plans.
The results
- 20% increase in asset utilization
- 15% reduction in equipment downtime
- 200+ outlets on one asset register
- 10% increase in overall store operational efficiency
- 10% decrease in maintenance-related disruptions to store operations
- 5% decrease in unnecessary asset replacements and repair costs
- Store managers and maintenance teams work from the same requests and records
Why it worked
Fitted to store work
The setup followed how the outlets already ran, so store managers had one simple way to report problems.
Servicing that follows usage
Plans based on meter readings and runtime put maintenance effort where equipment is used hardest.
Data for decisions
Utilization dashboards give head office facts to plan servicing and replacement across the network.
Looking ahead
With store assets, servicing and fault reporting in one system, the chain raised asset utilization by 20% and cut downtime by 15% across more than 200 outlets.
The usage history now building up for each asset gives the business a clearer basis for deciding when to service, move or replace equipment as the network grows.