

The client
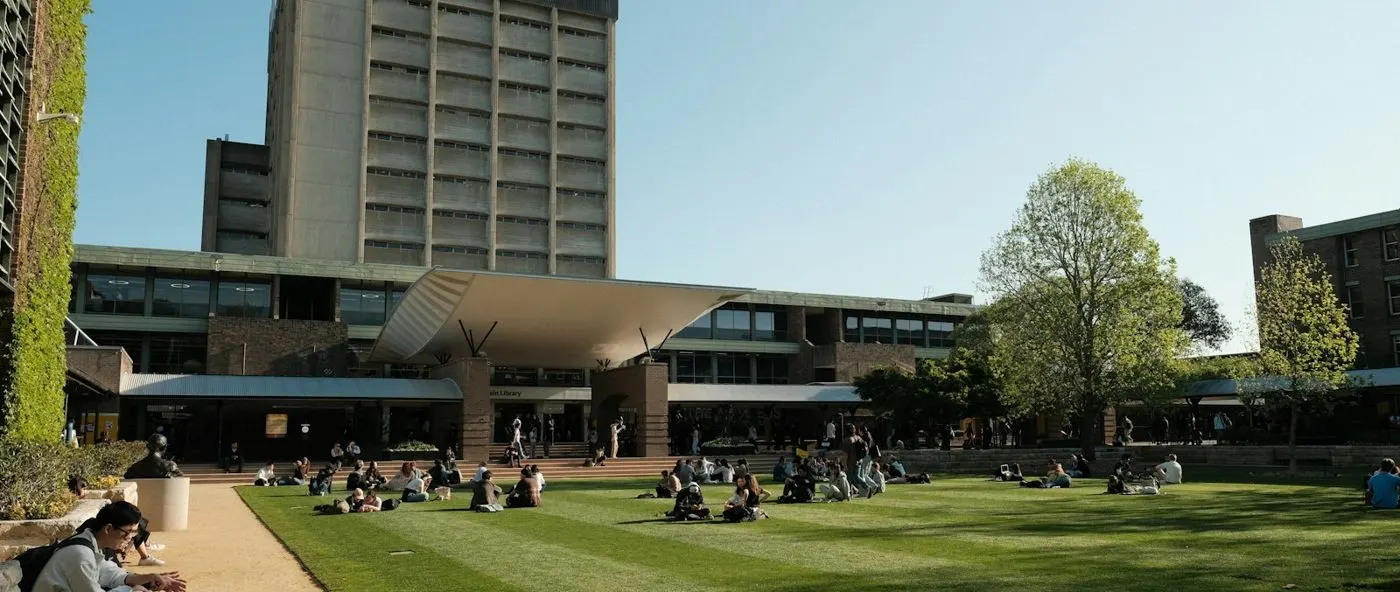
The client is a large university in India with academic buildings, laboratories, hostels, administrative blocks and shared facilities.
Each building uses utilities differently, from labs to residences. The university plans its utility budgets each year and needed to know what each building actually used and cost.
The challenge
Utility records existed, but budget planning relied on manually consolidated information and historical estimates, with little visibility at building level.
- No building-level view of consumption or cost.
- Budgets based on historical estimates.
- Utility information collected by hand for every budget review.
- Costs hard to compare across departments and facilities.
What they set up in Asset Infinity
The university centralized utility consumption and cost information for its campus facilities in Asset Infinity.
Meters for every building
Utility services and meters are mapped to academic buildings, laboratories, hostels and administrative blocks. (Energy)
Readings and costs
Facility teams record meter readings in a set structure, and utility costs are held against each building. (Energy)
Budgets against actuals
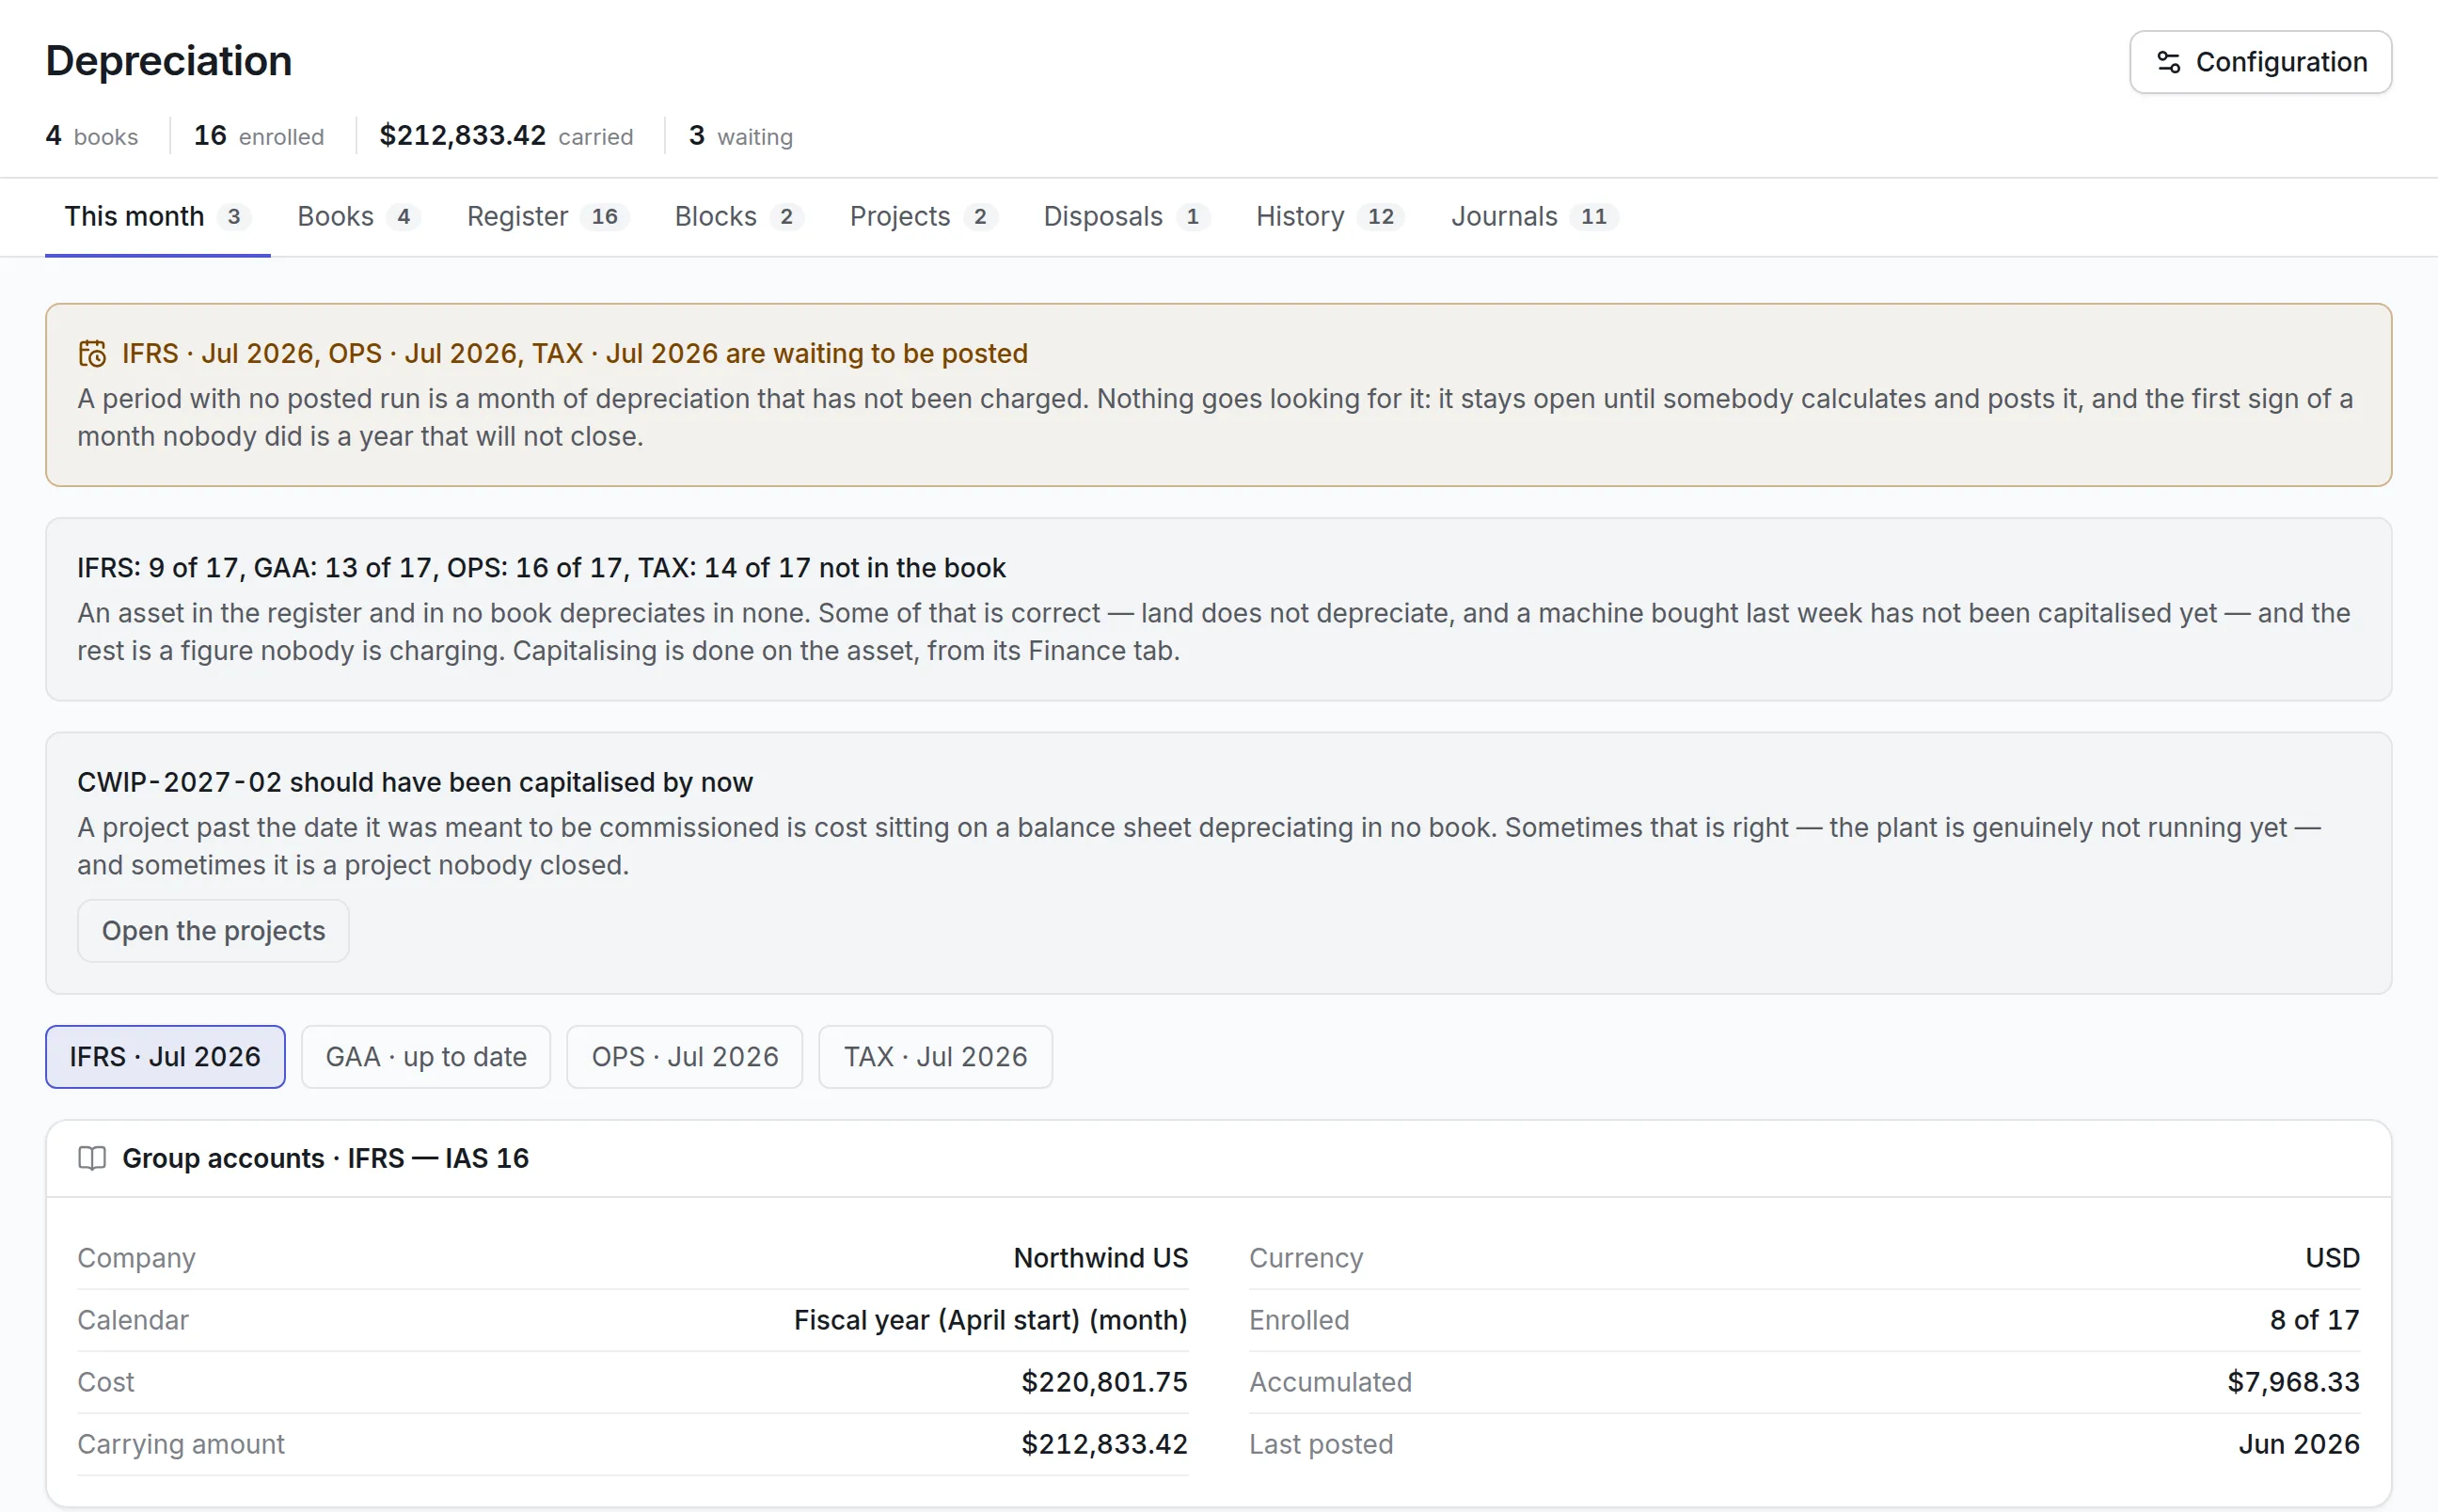
Utility budgets can be reviewed against recorded consumption and cost, using history instead of estimates. (Finance)
Building-level reports
Reports show consumption and cost by building and department, ready for budget reviews and campus planning. (Insight)
How it works day to day
Here is how utility data reaches the budget now.
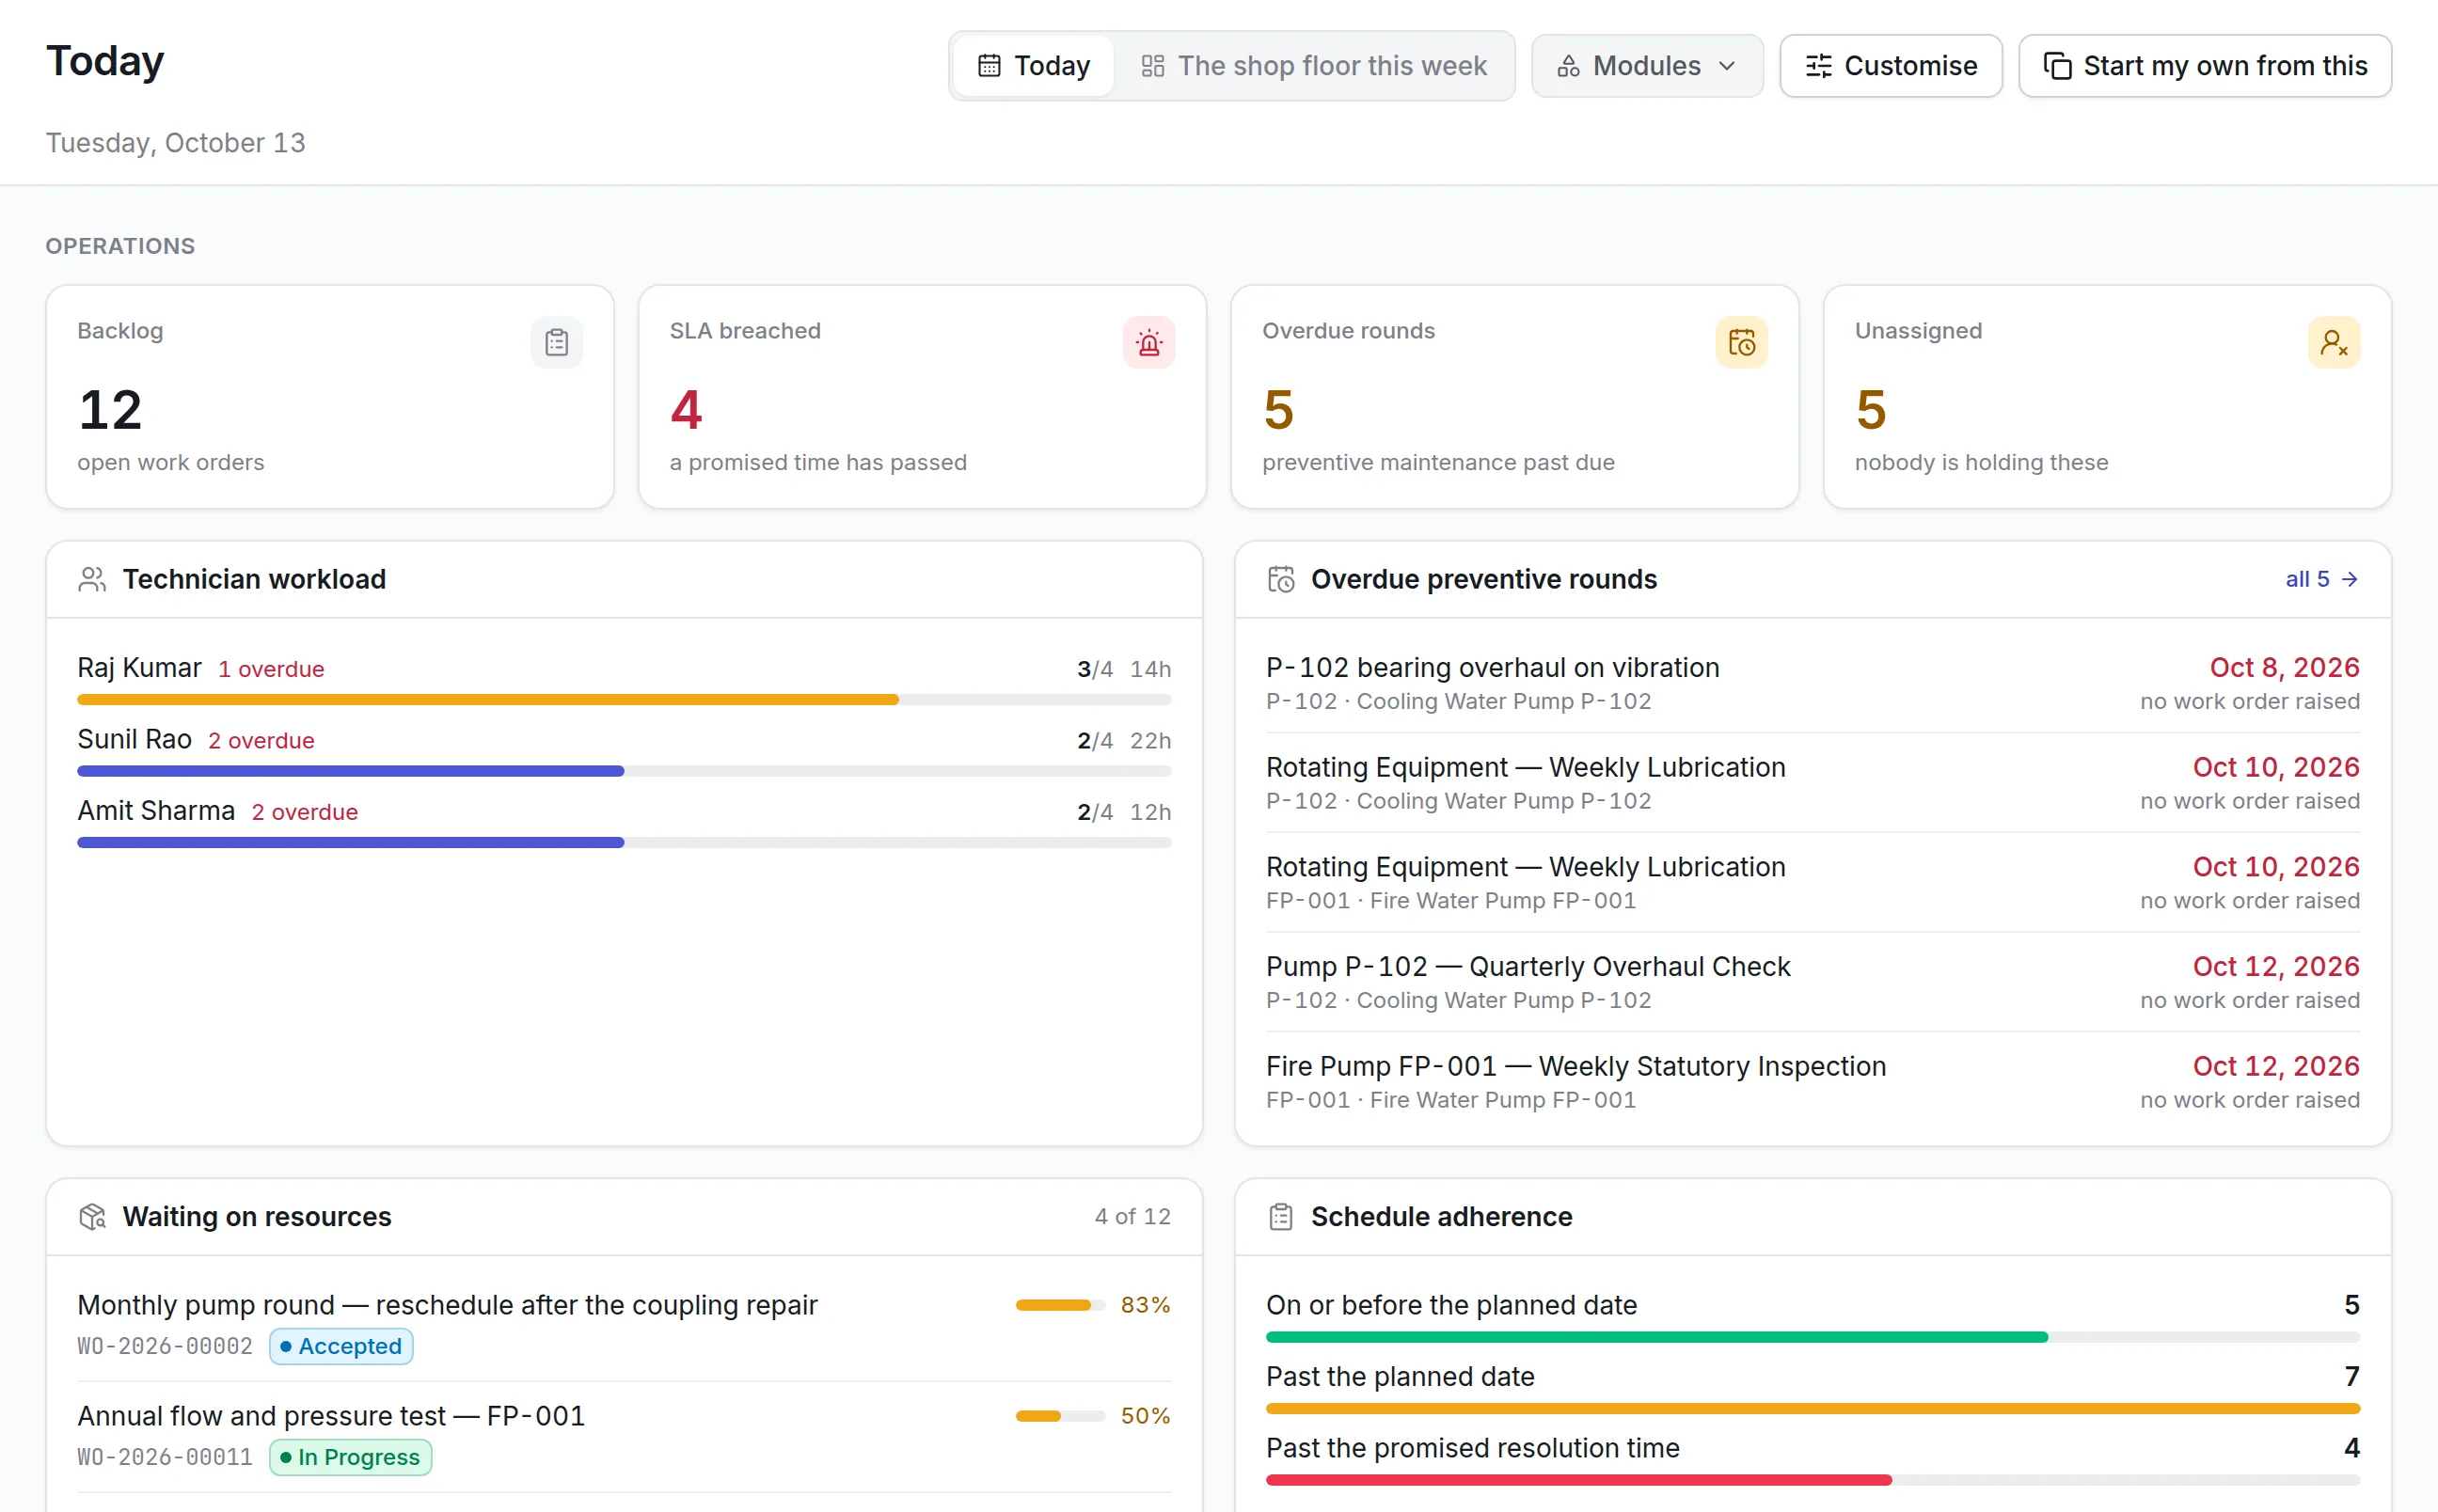
- Facility staff: record readings. Meter readings for each building are entered on schedule from the web or mobile app.
- System: calculates consumption. Readings become consumption per meter and building, building up a history over time.
- Facility office: records utility costs. Utility costs are entered against the relevant buildings, so consumption and spend sit side by side.
- Facility manager: compares buildings. Reports show which buildings, labs and hostels use the most and how usage changes through the year.
- Facility manager: follows up unusual use. A building whose consumption jumps is checked, and a maintenance request can be raised from the app if a fault is suspected.
- Finance team: reviews the budget. Budget reviews use recorded consumption and cost history by building, instead of manually collected figures.
Before and after
| Before | With Asset Infinity | |
|---|---|---|
| Budget basis | Historical estimates | Recorded consumption and cost history |
| Building-level view | Limited | Consumption and cost by building |
| Data collection | Consolidated by hand | Structured readings in one system |
| Cost comparison | Difficult | Across departments and facilities |
| Consumption review | Difficult across campus | Monitored across buildings, hostels and labs |
How it rolled out
- Practices reviewed. Campus facilities, utility records, costs and budgeting practices were reviewed.
- Buildings and meters set up. Facilities were configured, utility services and meters mapped, and reading capture structured.
- Teams trained, reports refined. Facility teams were trained, and reporting refined for budget planning.
The results
- Clearer consumption and cost information across campus facilities
- Budget reviews supported by centralized and historical utility data
- Better understanding of utility costs by department and facility
- Less manual collection of utility information for budget reviews
- Better monitoring of usage across buildings, hostels and laboratories
Why it worked
Every building mapped
Meters were tied to each building, so consumption could be compared where it happens.
History builds itself
Regular readings create the history that budget reviews need, with no extra work.
Reports made for budgeting
Reporting was refined around the questions finance asks at budget time.
Looking ahead
The university moved from manually consolidated utility records to central consumption and cost visibility across its campus.
Budget reviews now draw on recorded usage and history for each building, giving facility and finance teams stronger data for utility budgeting and campus planning.