

The client
The client is a large manufacturing enterprise with multiple production facilities across India.
Stores, purchasing and production all depend on knowing what stock is on hand, how fast it is used and what will be needed next. The data existed, but turning it into decisions took a lot of manual work.
The challenge
Stock was being recorded, but forecasting and purchasing still relied on separate reports, spreadsheets and manual analysis by stores and purchasing teams.
- No central place to analyze inventory data.
- Little visibility into consumption patterns.
- Risk of excess stock in some items and shortages in others.
- Purchasing decisions delayed while reports were prepared by hand.
What they set up in Asset Infinity
The manufacturer centralized inventory records, movements and history in Asset Infinity and set up reports and dashboards for planning and purchasing.
One record of stock and movements
Stock levels, locations and every receipt, issue and transfer are recorded in one system, building the history that planning needs. (Stores)
Inventory reports
Reports cover stock levels, movements, locations and usage patterns, built in the report builder instead of assembled in spreadsheets. (Insight)
Dashboards by role
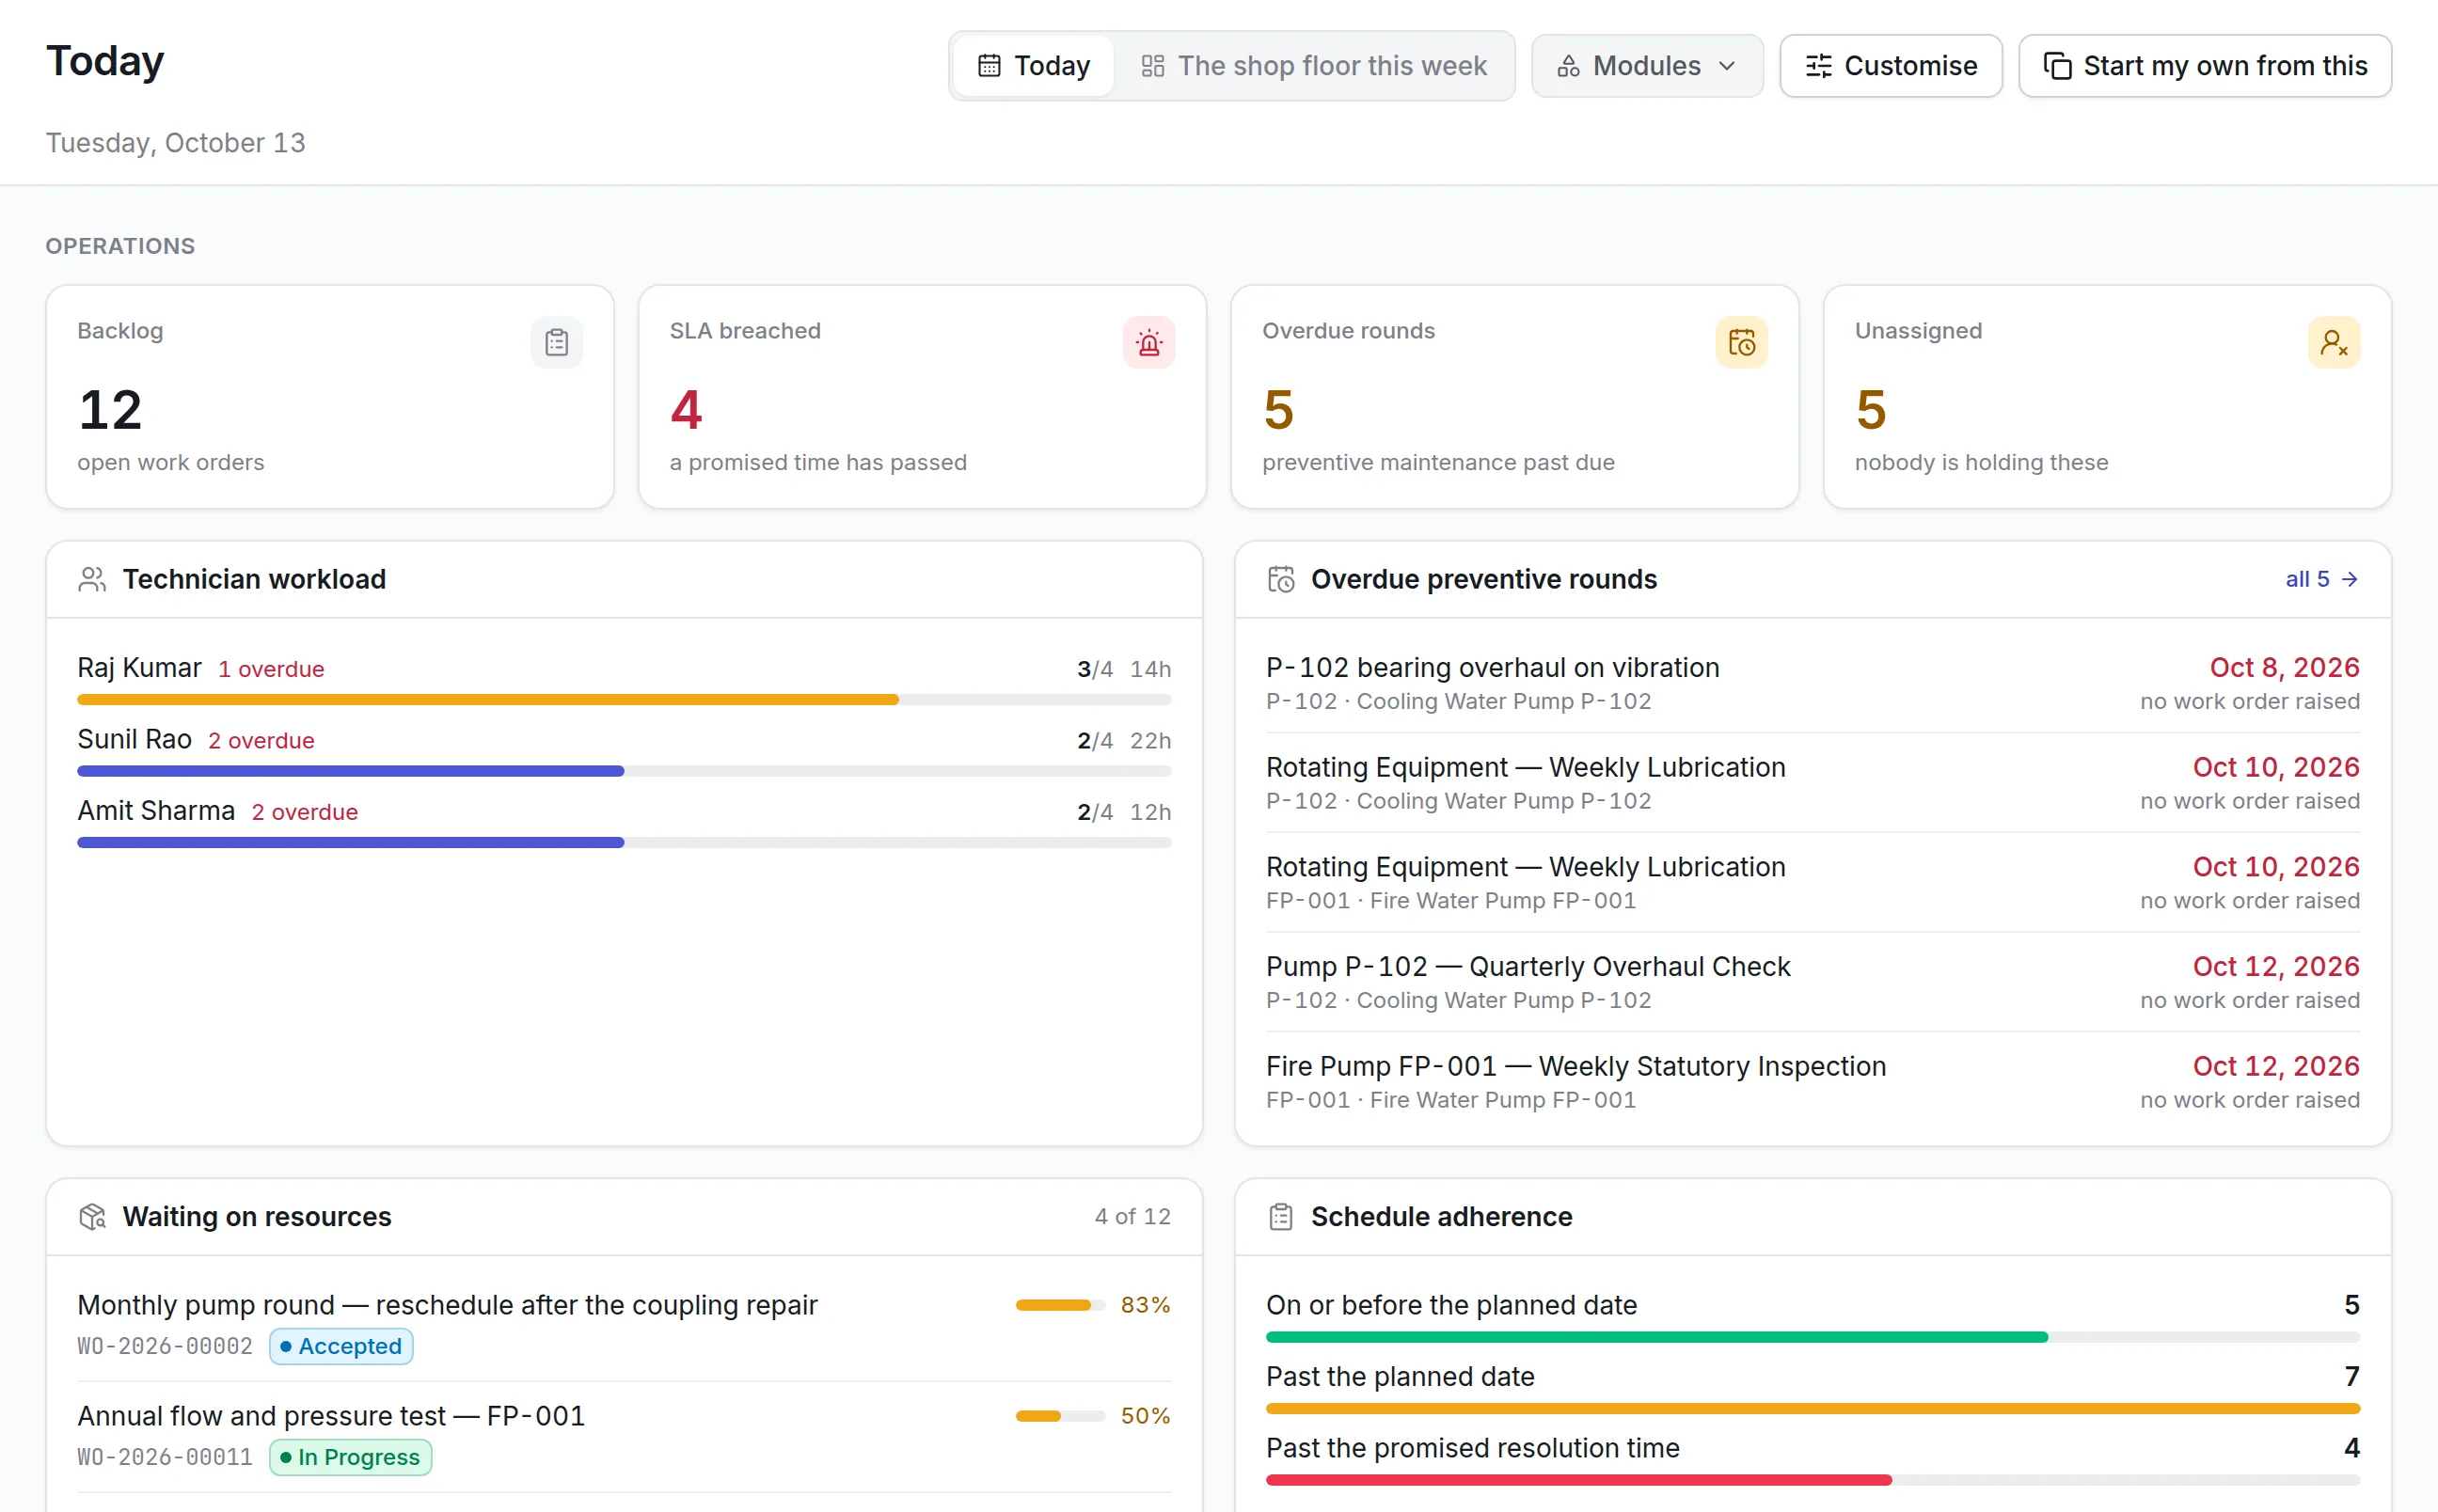
Operational users and managers each see the inventory information relevant to them on their own dashboards. (Insight)
Usage-based reorder advice
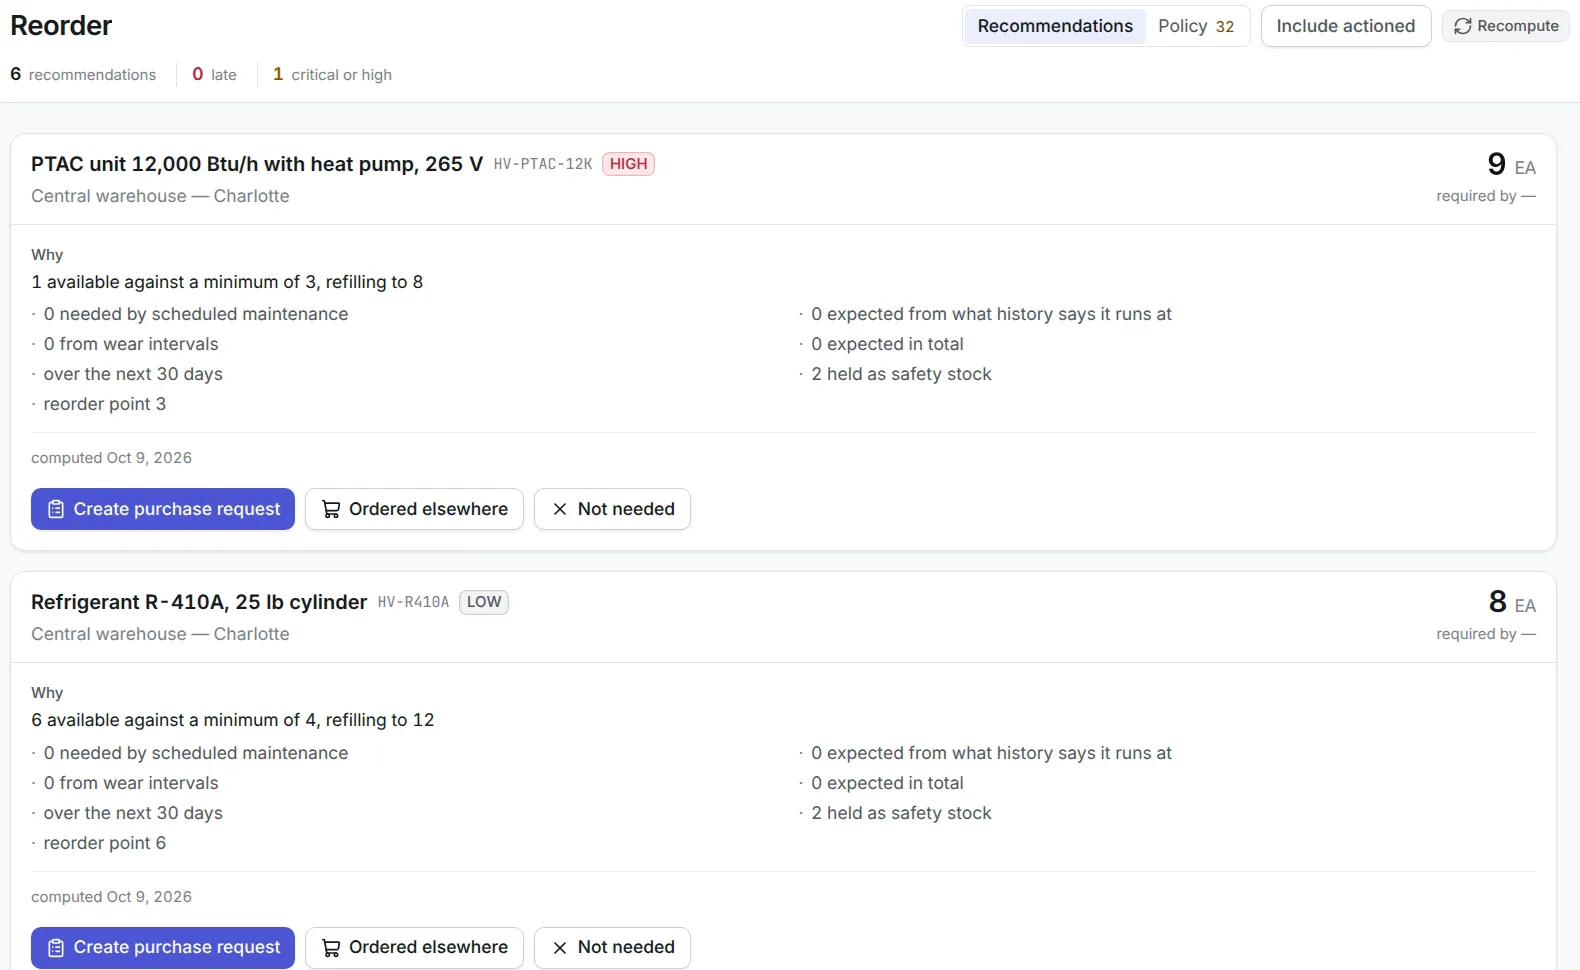
Consumption history feeds reorder advice, helping teams see requirements before shortages affect production. (Stores)
How it works day to day
Here is how inventory data turns into decisions now.
- Storekeeper: records receipts and issues. Every receipt, issue and transfer is entered as it happens, so stock levels and movement history stay current.
- System: builds the history. Movements accumulate into consumption history for each item and location, which reports and reorder advice draw on.
- Store manager: checks the dashboard. The manager sees stock levels, slow movers and items near their reorder point at a glance.
- Planner: reviews usage patterns. Reports on usage by item and location show trends that inform the stock plan for the coming period.
- Purchasing: decides what to buy. Purchasing uses current stock and movement data to raise purchase requests for what is actually needed.
- Management: gets reports on schedule. Scheduled reports deliver inventory summaries to managers regularly, without anyone preparing them by hand.
Before and after
| Before | With Asset Infinity | |
|---|---|---|
| Inventory reports | Separate spreadsheets, prepared by hand | Centralized reports and dashboards |
| Consumption patterns | Limited visibility | Usage reports by item and location |
| Forecasting | Manual analysis | Based on inventory trends and history |
| Purchasing | Delayed decisions | Based on current stock and movements |
| Availability | Risk of excess stock and shortages | Requirements seen before shortages |
How it rolled out
- Gaps reviewed. Reporting practices, planning requirements and information gaps were reviewed with stores and purchasing.
- Data and reports configured. Inventory records, movements and history were centralized, and reports and dashboards set up for each group of users.
- Teams trained, reports refined. Inventory teams were trained on reporting and planning, and reports adjusted as needs changed.
The results
- Inventory trends and history now support stock planning
- Purchasing decisions based on current stock and movement data
- Requirements identified before shortages affect operations
- Less dependence on manual spreadsheets and separately prepared reports
- Clearer visibility of stock levels, movements and availability
Why it worked
Data recorded once
Stock and movements are captured as they happen, so reports never need to be pieced together.
Reports for each role
Operational users and managers each see what they need, so the data gets used.
Kept up to date
Reports and views were refined as planning requirements changed.
Looking ahead
The manufacturer moved from manually reviewing inventory reports to planning from centralized, current data. Stock information now becomes insight for forecasting, purchasing and availability without a spreadsheet in between.
Stores, purchasing and production work from the same numbers, and reports keep pace as planning needs change.