

The client
The client is a large multinational consumer goods corporation headquartered in Dubai, with offices, facilities and operational locations around the world.
Every site uses electricity, water and other utilities. Local teams were capturing readings, but central teams had no easy way to see consumption by site or compare one location with another.
The challenge
Utility readings were captured locally and kept in separate records. To understand consumption, central teams had to collect spreadsheets and build reports by hand.
- Readings sat in separate local records and spreadsheets.
- Central reporting on consumption was manual.
- Without location-level visibility, sites were hard to compare.
- Control over utility usage across the business was weak.
What they set up in Asset Infinity
The corporation brought utility meters and readings for every location into Asset Infinity, giving central teams one consistent view of consumption.
Meters for every location
Offices, facilities and operational locations were set up with their relevant utilities and meters, site by site. (Energy)
Structured reading capture
Local teams record readings against each meter in the same way at every location, building a consumption history per site. (Energy)
Consumption by location
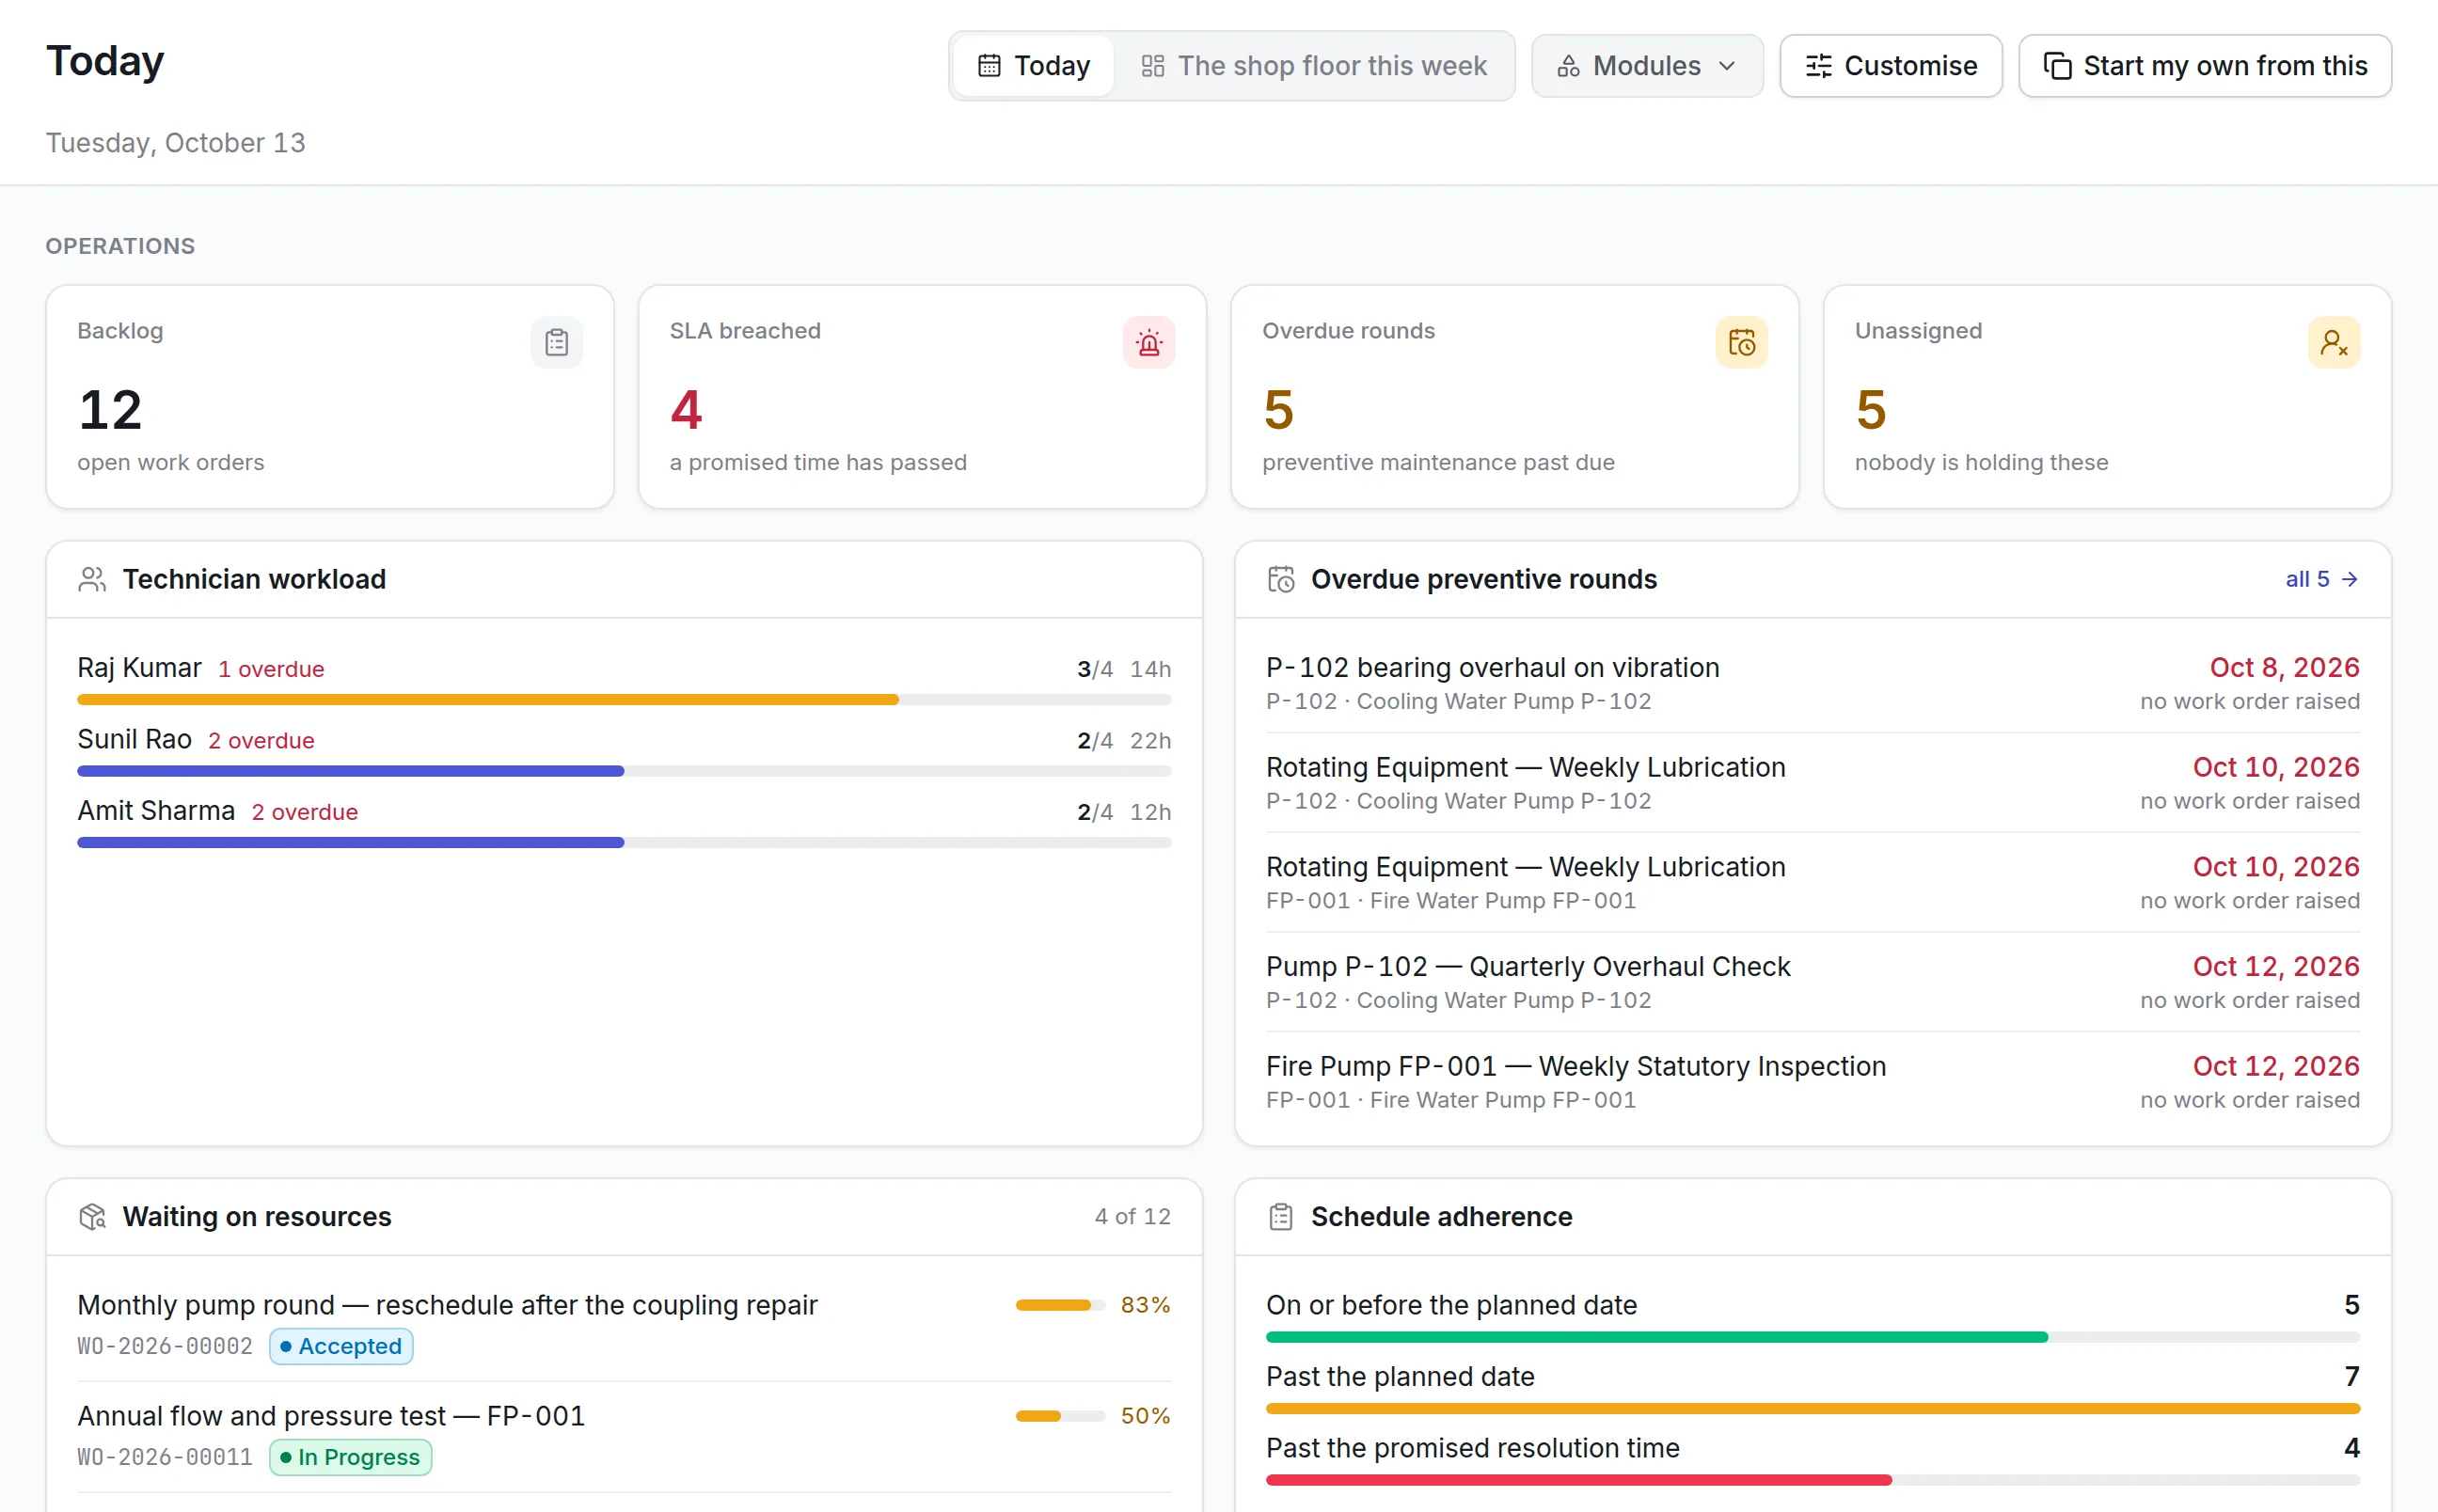
Dashboards show consumption by facility, location and operational unit, so central teams can compare sites and spot changing patterns. (Insight)
Reports without spreadsheets
Scheduled reports replace the spreadsheets central teams used to assemble from local records. (Insight)
How it works day to day
Here is how utility data now flows from each site to head office.
- Site facility team: records the reading. At each location, the team records meter readings in the web or mobile app against the right utility and meter.
- System: builds the history. Each reading adds to that meter’s consumption history, so usage over time is available without extra work.
- Site manager: checks local consumption. The site manager sees current and past consumption for the location and notices changes early.
- Regional manager: reviews the region. Consumption for every site in the region is shown together, so an unusual location stands out without a request for figures.
- Central team: compares sites. Dashboards show consumption by facility, location and unit, making it easy to compare similar sites.
- System: sends scheduled reports. Scheduled reports go to central and regional managers, replacing spreadsheets compiled by hand.
Before and after
| Before | With Asset Infinity | |
|---|---|---|
| Readings | Captured locally in separate records | Recorded against each meter in one system |
| Reporting | Spreadsheets and manual reports | Dashboards and scheduled reports |
| Visibility | No location-level view | Consumption by facility, location and unit |
| Comparison | Difficult across sites | Sites compared side by side |
| Control | Weak oversight of usage | Central monitoring of consumption |
How it rolled out
- Utilities and sites reviewed. The team reviewed utility types, locations, reading practices and reporting problems.
- Locations and meters set up. Offices, facilities and sites were configured, utilities and meters mapped, and reading capture structured.
- Teams trained, monitoring refined. Facility teams were trained on readings and monitoring, and the setup was refined after usage data was reviewed.
The results
- Detailed consumption visibility across facilities, locations and units
- Readings from many locations consolidated in one place
- Easier comparison of consumption between sites
- Less dependence on spreadsheets and manual reporting
- Clearer view of usage and changing consumption patterns
- Stronger utility oversight across global operations
Why it worked
Same method everywhere
Every site records readings the same way, which is what makes comparisons between locations meaningful.
Granular from the start
Meters were mapped to individual locations and units, so data can be broken down as finely as the business needs.
Refined from real data
Monitoring was adjusted after reviewing actual usage data, keeping it useful to central teams.
Looking ahead
The corporation moved from fragmented utility records to central, location-level consumption tracking across its global sites.
Readings are captured in one structured way and consolidated automatically. That has cut manual reporting, made comparisons between sites easy and strengthened oversight of utility use across the business.