


In this article
- What Are Maintenance KPIs?
- Why Maintenance KPIs and Reporting Matter
- Leading vs Lagging Maintenance KPIs
- Leading Indicators
- Lagging Indicators
- Categories of Maintenance KPIs
- Reliability Maintenance KPIs
- Mean Time Between Failures
- Mean Time to Failure
- Failure Rate
- Repeat Failure Rate
- Overall Equipment Effectiveness
- Downtime and Availability KPIs
- Total Equipment Downtime
- Unplanned Downtime
- Planned Downtime
- Asset Availability
- Mean Downtime
- Repair and Response KPIs
- Mean Time to Repair
- Mean Time to Respond
- Mean Time to Detect
- Mean Time to Acknowledge
- Preventive Maintenance KPIs
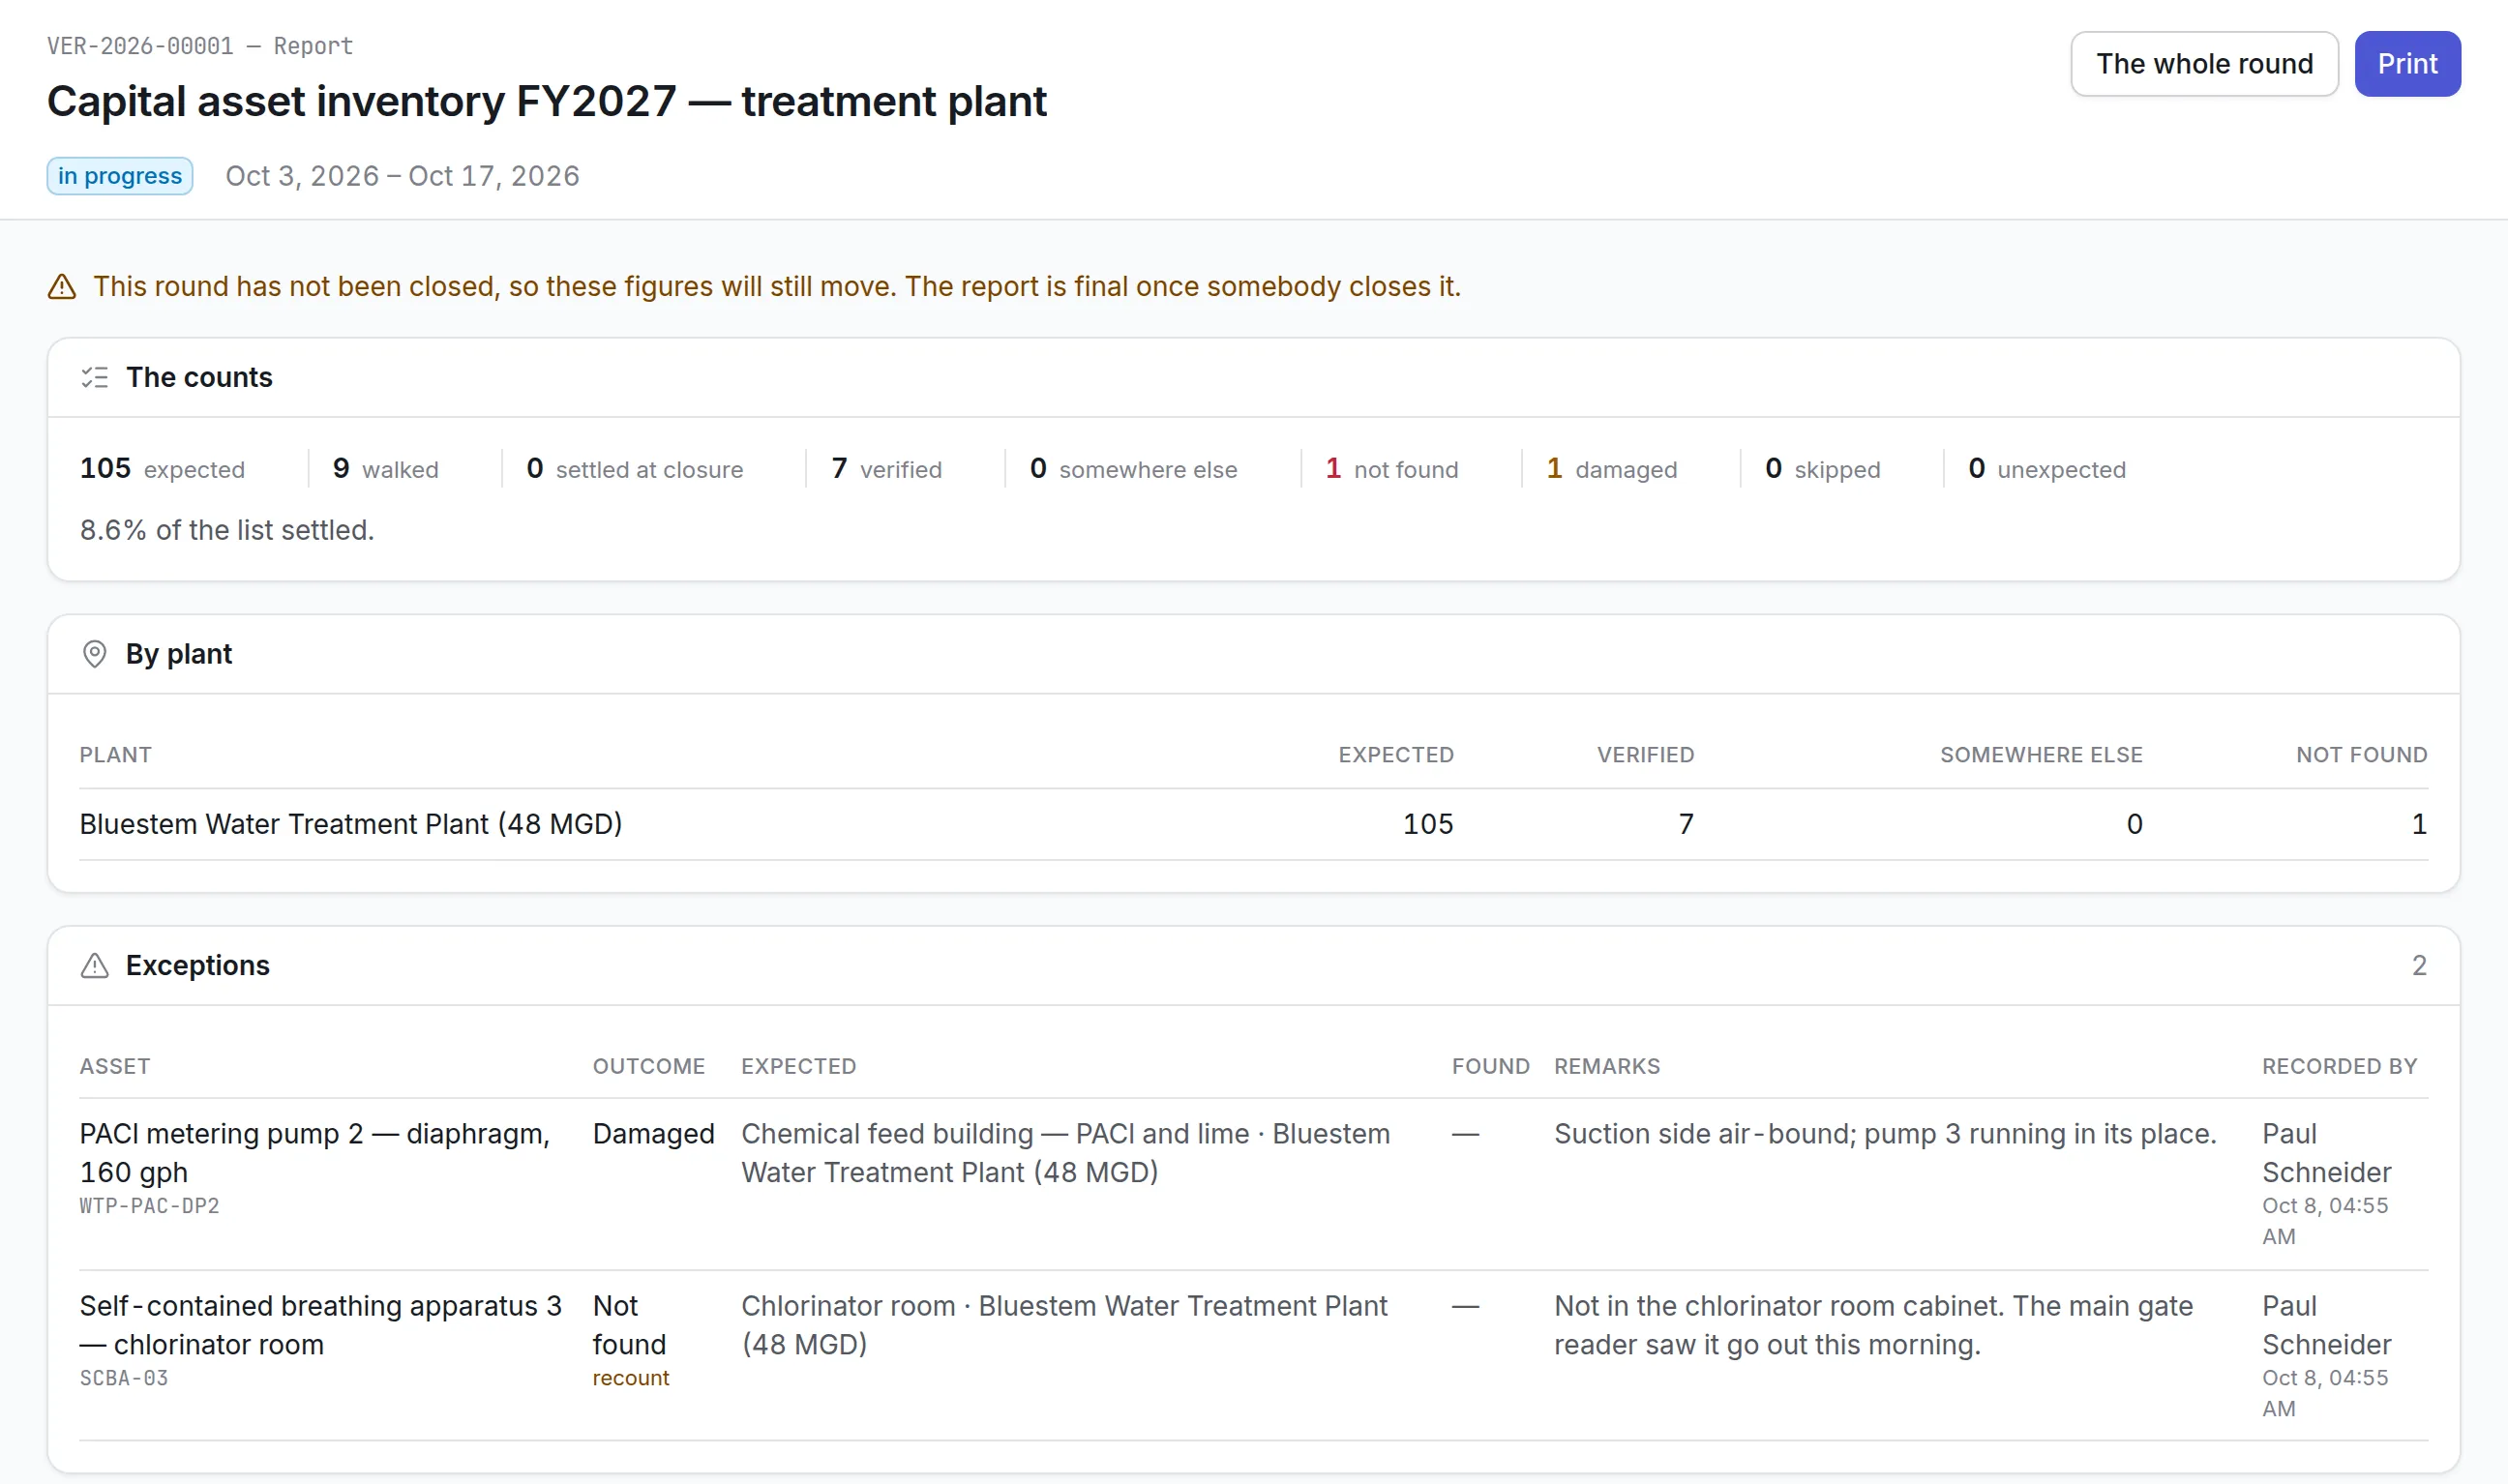
- Preventive Maintenance Compliance
- Planned Maintenance Percentage
- Preventive Maintenance Effectiveness
- Preventive Maintenance Yield
- Percentage of Preventive Work Orders
- Work Order Performance KPIs
- Work Order Completion Rate
- On-Time Work Order Completion
- Work Order Cycle Time
- Work Order Reopen Rate
- Emergency Work Order Rate
- Maintenance Backlog and Scheduling KPIs
- Maintenance Backlog
- Backlog Age
- Schedule Compliance
- Ready Backlog
- Planning Accuracy
- Maintenance Cost KPIs
- Total Maintenance Cost
- Maintenance Cost per Asset
- Maintenance Cost as a Percentage of Replacement Asset Value
- Labor Cost Percentage
- Spare Parts Cost Percentage
- Emergency Maintenance Cost
- Maintenance Cost Avoidance
- Technician Productivity KPIs
- Wrench Time
- Technician Utilization
- Work Orders Completed per Technician
- First-Time Fix Rate
- Overtime Percentage
- Spare Parts and Inventory KPIs
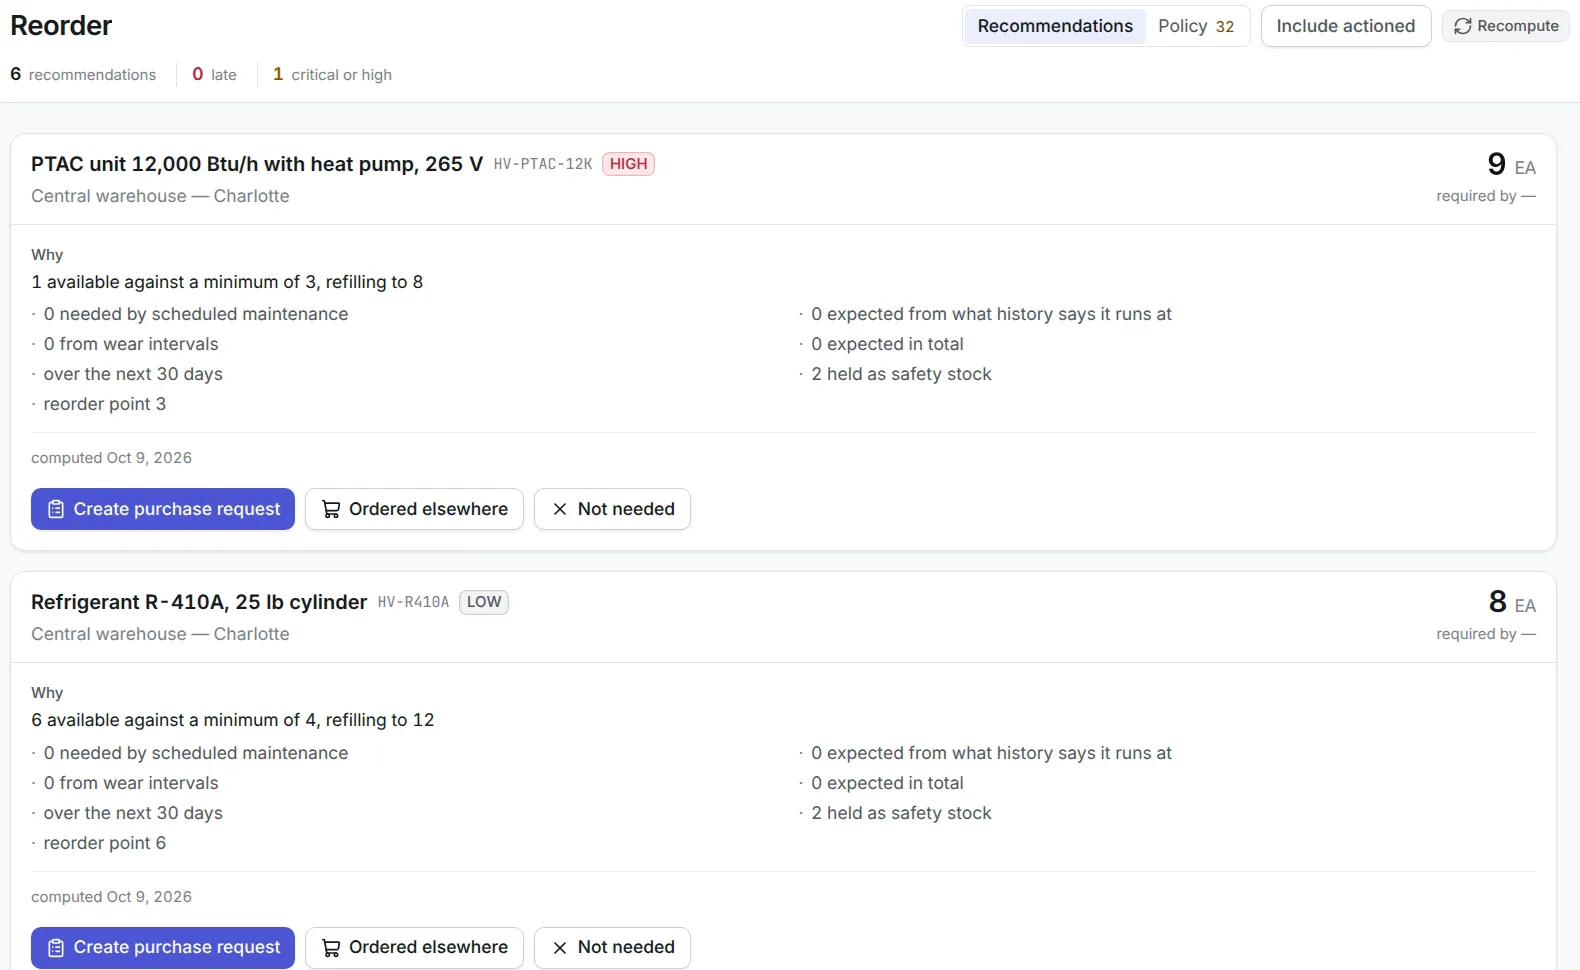
- Spare Parts Stockout Rate
- Inventory Turnover
- Critical Spare Availability
- Obsolete Inventory Percentage
- Parts Usage Accuracy
- Safety and Compliance KPIs
- Safety-Related Work Order Completion
- Inspection Compliance
- Audit Finding Closure Rate
- Permit and Checklist Compliance
- Maintenance-Related Incident Rate
- Asset Performance KPIs
- Asset Utilization
- Asset Performance Index
- Lifecycle Cost
- Remaining Useful Life
- How to Build an Effective Maintenance Reporting System
- Choose the Right Reporting Frequency
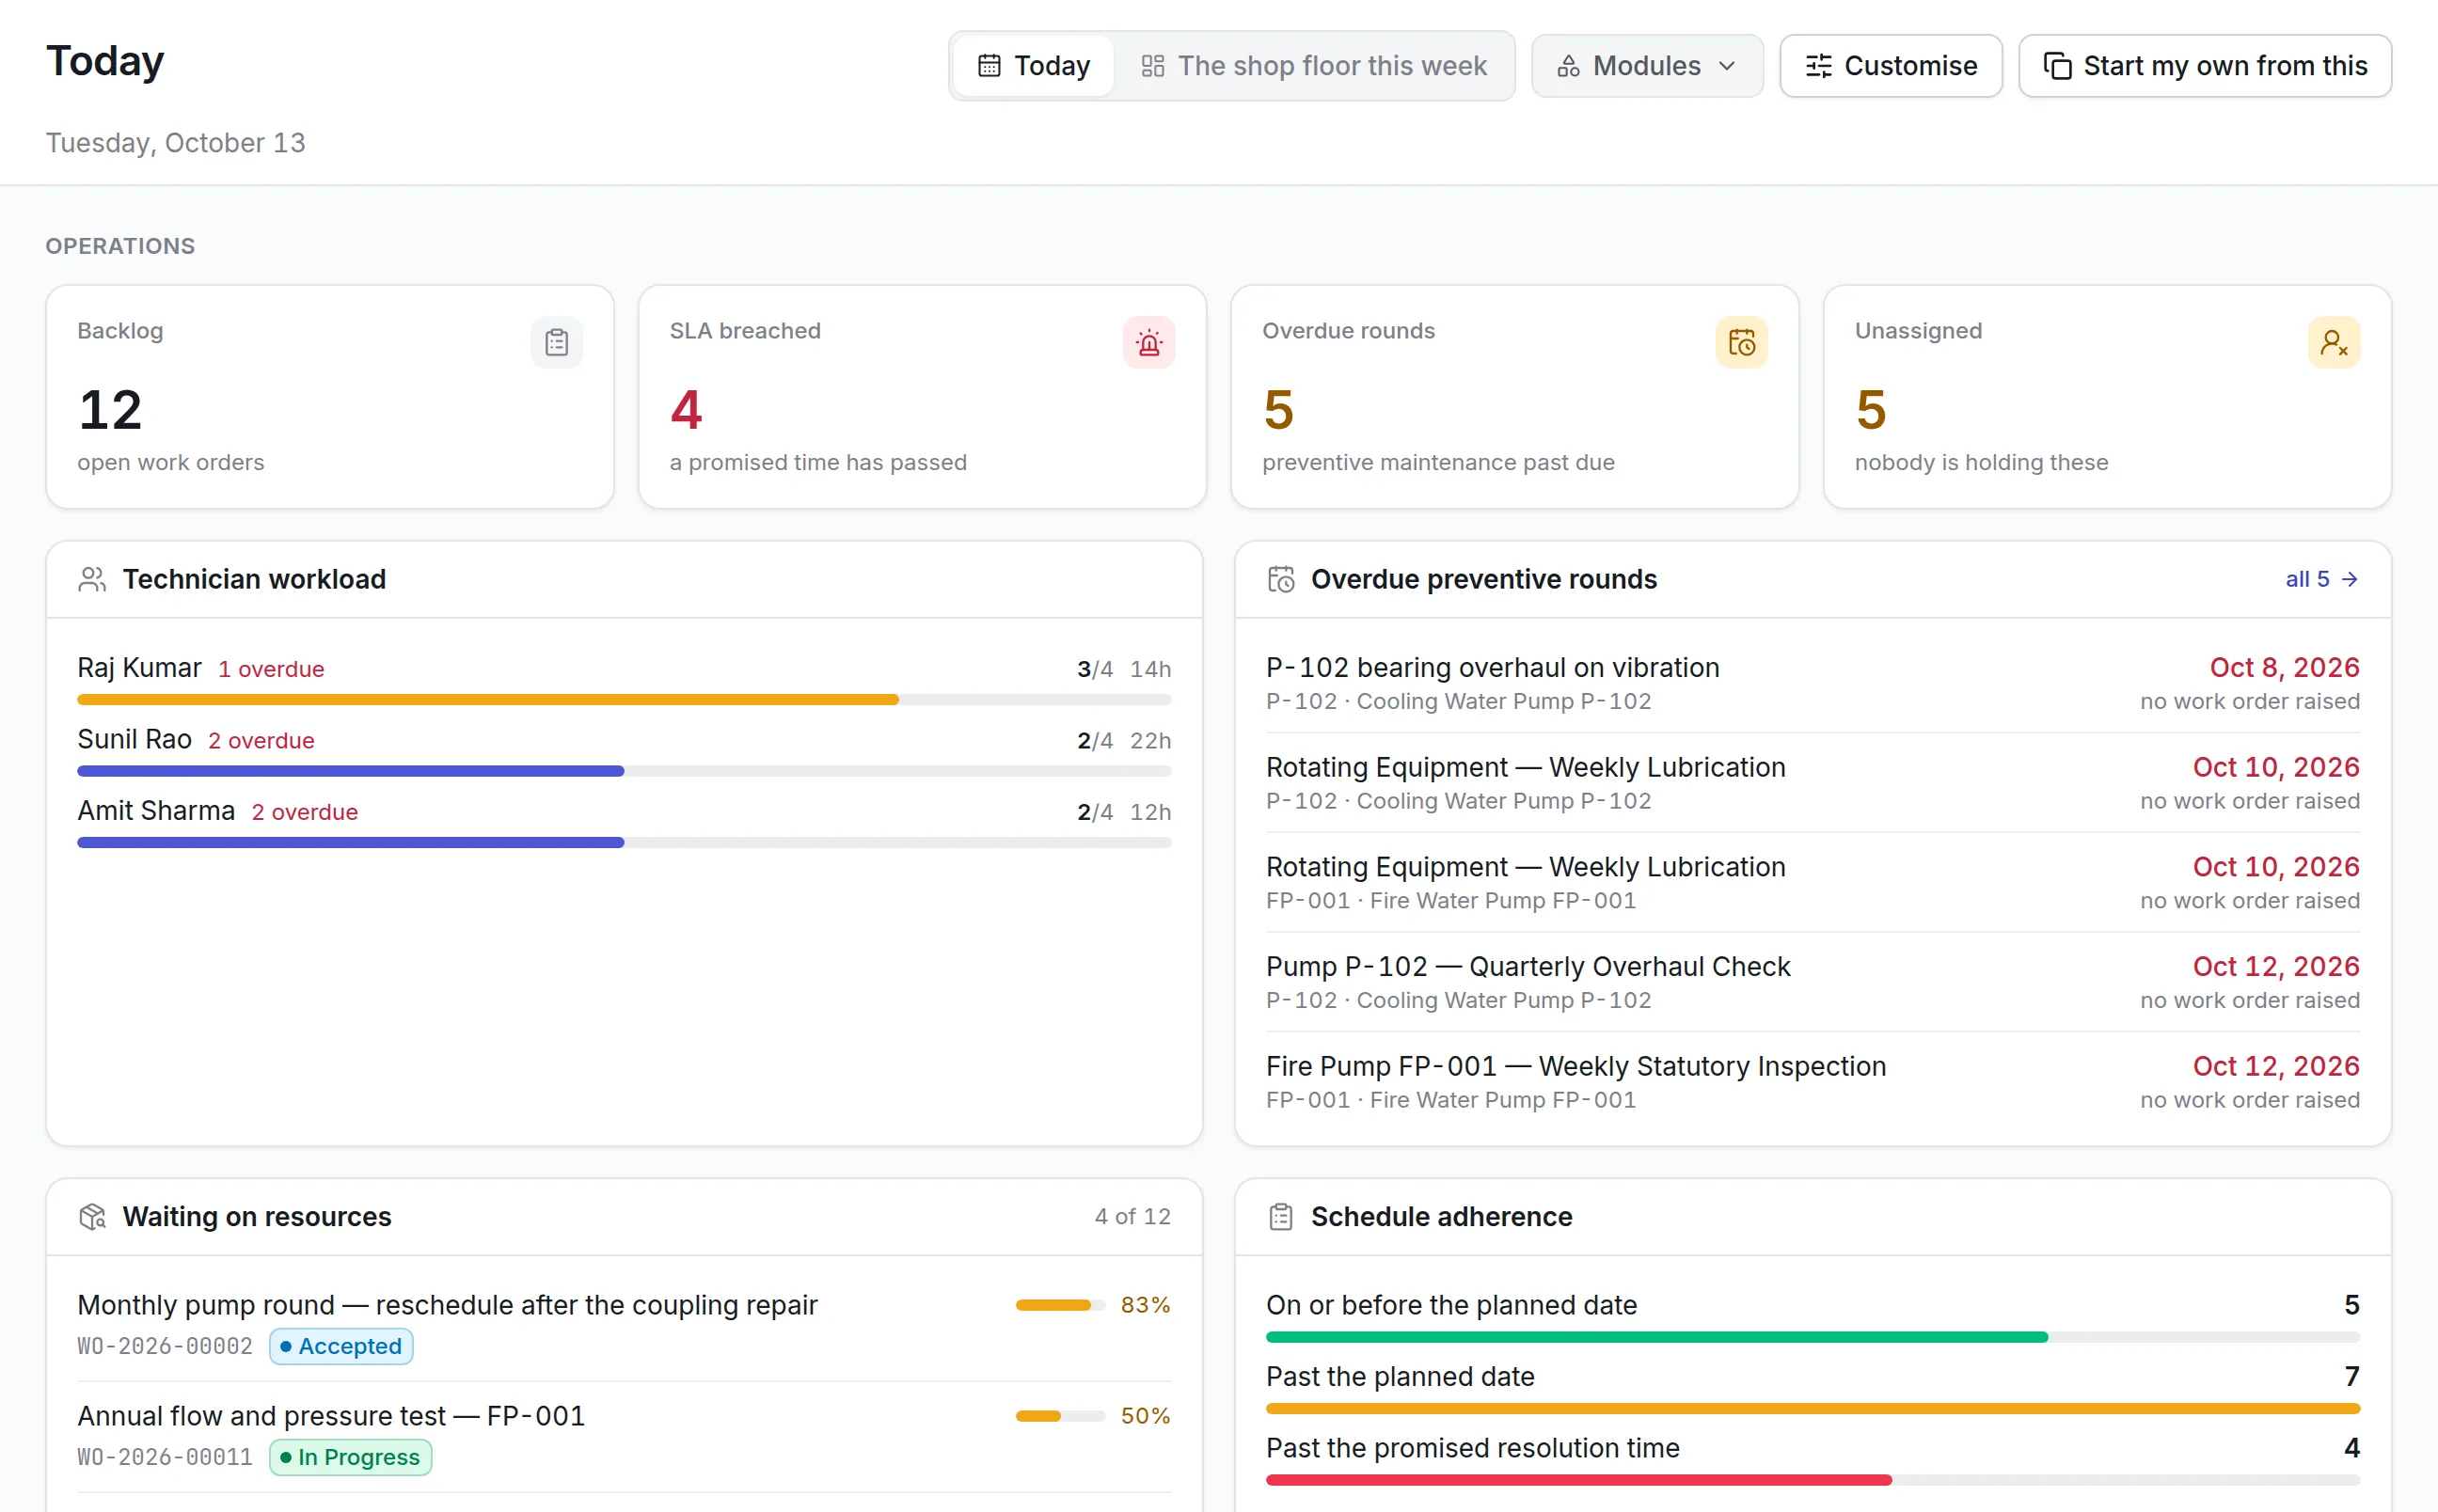
- What Should a Maintenance Dashboard Include?
- Common Maintenance Reporting Mistakes
- Best Practices for Maintenance KPIs and Reporting
- How Maintenance Management Software Improves KPI Reporting
- Why Choose Asset Infinity for Maintenance Reporting?
- How to Start Measuring Maintenance Performance
- Conclusion
- Frequently Asked Questions
Maintenance teams complete inspections, repairs, preventive tasks, emergency work orders, and equipment servicing every day. However, completing maintenance work does not automatically mean the maintenance program is effective.
Organizations need reliable data to understand whether assets are becoming more dependable, whether downtime is decreasing, whether technicians are productive, and whether maintenance costs are under control.
This is where maintenance KPIs and reporting become essential.
Maintenance key performance indicators convert operational activity into measurable insights. They show how frequently assets fail, how quickly repairs are completed, how much maintenance costs, how much planned work is being completed, and whether maintenance activities are supporting broader business goals.
Without clearly defined metrics, maintenance teams may focus on closing work orders without understanding whether those activities improve reliability or reduce operational risk.
This guide explains the most important maintenance KPIs, reporting methods, formulas, common mistakes, dashboard practices, and ways to use maintenance data for better decision-making.
What Are Maintenance KPIs?
Maintenance KPIs are measurable values used to evaluate the effectiveness, efficiency, reliability, and cost of maintenance operations.
They help organizations understand:
- How often assets fail
- How long equipment remains unavailable
- How quickly technicians complete repairs
- How much maintenance costs
- Whether preventive maintenance is completed on time
- How much work is planned versus reactive
- Whether maintenance backlogs are increasing
- How effectively technicians and contractors are being used
- Whether asset performance is improving
- Whether maintenance supports safety and compliance
A good maintenance KPI should be clearly defined, measurable, relevant, consistent, and connected to a specific business objective.
Why Maintenance KPIs and Reporting Matter
Maintenance teams often manage large volumes of work orders across multiple locations, departments, and asset categories.
Without reporting, it becomes difficult to know:
- Which assets fail most frequently
- Which equipment creates the highest downtime costs
- Whether preventive maintenance is effective
- Why work orders remain incomplete
- Which spare parts are used most often
- Whether technicians are overloaded
- Whether maintenance spending is increasing
- Whether recurring failures are being resolved
- Whether maintenance schedules are realistic
Maintenance reporting turns raw work order and asset data into useful management information.
It enables maintenance leaders to:
- Set performance targets
- Compare results over time
- Identify reliability problems
- Justify maintenance investments
- Improve budget planning
- Prioritize critical assets
- Reduce unplanned downtime
- Improve technician productivity
- Support audits and compliance
- Communicate performance to senior management
Leading vs Lagging Maintenance KPIs
Maintenance KPIs can be divided into leading and lagging indicators.
Leading Indicators
Leading indicators measure activities that influence future maintenance performance.
Examples include:
- Preventive maintenance compliance
- Planned maintenance percentage
- Schedule compliance
- Inspection completion
- Maintenance backlog
- Work order planning accuracy
- Training completion
- Condition monitoring coverage
These indicators help organizations identify whether the right maintenance processes are being followed.
Lagging Indicators
Lagging indicators measure results that have already occurred.
Examples include:
- Equipment downtime
- Breakdown frequency
- Mean Time Between Failures
- Mean Time to Repair
- Maintenance cost
- Emergency work order rate
- Asset availability
- Repeat failure rate
Lagging indicators show the outcome of past maintenance activities.
An effective reporting system should include both types. Leading indicators show whether maintenance processes are improving, while lagging indicators show whether those improvements are producing better results.
Categories of Maintenance KPIs
The most useful maintenance metrics usually fall into the following categories:
- Reliability metrics
- Downtime and availability metrics
- Maintenance cost metrics
- Work order metrics
- Preventive maintenance metrics
- Backlog and scheduling metrics
- Technician productivity metrics
- Inventory and spare parts metrics
- Safety and compliance metrics
- Asset performance metrics
Using metrics from multiple categories provides a more balanced view than relying on a single KPI.
Reliability Maintenance KPIs
Reliability KPIs measure how consistently assets perform their intended function without failure.
Mean Time Between Failures
Mean Time Between Failures, commonly called MTBF, measures the average operating time between repairable equipment failures.
It helps maintenance teams evaluate asset reliability.
The formula is:
MTBF = Total Operating Time ÷ Number of Failures
For example, if a machine operates for 2,000 hours and fails four times, its MTBF is 500 hours.
A higher MTBF generally indicates better reliability.
MTBF Is Useful For:
- Identifying unreliable equipment
- Comparing similar assets
- Measuring reliability improvements
- Evaluating preventive maintenance effectiveness
- Supporting replacement decisions
- Prioritizing root cause analysis
MTBF should only be compared across similar assets and operating conditions.
Mean Time to Failure
Mean Time to Failure, or MTTF, measures the average operating life of a nonrepairable asset or component before it fails.
The formula is:
MTTF = Total Operating Time of Assets ÷ Number of Failed Assets
MTTF is often used for:
- Light bulbs
- Batteries
- Disposable components
- Electronic devices
- Nonrepairable equipment
- Replaceable sensors
Unlike MTBF, which applies to repairable assets, MTTF is generally used for items that are replaced after failure.
Failure Rate
Failure rate measures how often an asset or group of assets fails during a specific period.
The formula is:
Failure Rate = Number of Failures ÷ Total Operating Time
It may also be measured as failures per month, quarter, production cycle, or 1,000 operating hours.
Failure rate helps identify:
- Frequent breakdowns
- Unreliable asset categories
- Poor maintenance practices
- Design or installation issues
- Assets requiring replacement
- Changes in equipment condition
Repeat Failure Rate
Repeat failure rate measures how often the same fault returns after repair.
A high repeat failure rate may indicate:
- Incomplete repairs
- Poor diagnosis
- Low-quality spare parts
- Missing root cause analysis
- Technician training gaps
- Incorrect operating practices
- Equipment design problems
The formula is:
Repeat Failure Rate = Repeat Failures ÷ Total Failures × 100
This KPI helps maintenance teams distinguish between closing work orders and permanently resolving problems.
Overall Equipment Effectiveness
Overall Equipment Effectiveness, or OEE, measures how effectively equipment is being used.
It combines three elements:
- Availability
- Performance
- Quality
The formula is:
OEE = Availability × Performance × Quality
OEE is especially useful in manufacturing and production environments.
A low OEE may be caused by:
- Equipment downtime
- Slow operating speed
- Minor stops
- Defective output
- Setup delays
- Poor maintenance
- Operator-related losses
Maintenance teams usually influence the availability and performance components most directly.
Downtime and Availability KPIs
Downtime metrics measure how long assets remain unavailable and how equipment failures affect operations.
Total Equipment Downtime
Total equipment downtime measures the amount of time an asset cannot perform its intended function.
Downtime may include:
- Unplanned breakdowns
- Emergency repairs
- Planned maintenance
- Setup and changeover delays
- Waiting for spare parts
- Technician response delays
- Inspection or testing time
Organizations should separate planned and unplanned downtime because they represent different operational conditions.
Unplanned Downtime
Unplanned downtime is the time an asset remains unavailable because of an unexpected failure or operational issue.
It is one of the most important maintenance performance indicators because unplanned downtime can affect:
- Production
- Revenue
- Customer service
- Employee productivity
- Delivery schedules
- Safety
- Compliance
- Operating costs
Reducing unplanned downtime is often a primary objective of preventive and predictive maintenance programs.
Planned Downtime
Planned downtime occurs when equipment is intentionally removed from service for:
- Preventive maintenance
- Inspections
- Calibration
- Component replacement
- Upgrades
- Turnaround maintenance
- Cleaning
- Compliance activities
Planned downtime is easier to control because teams can prepare labor, spare parts, tools, and production schedules in advance.
Asset Availability
Asset availability measures the percentage of time equipment is available for operation.
A commonly used formula is:
Availability = Operating Time ÷ Planned Production Time × 100
Availability may also be calculated using MTBF and MTTR:
Availability = MTBF ÷ (MTBF + MTTR) × 100
Higher availability means the asset spends more time ready for use.
However, availability should not be viewed alone. An asset may be technically available but operating slowly or producing poor-quality output.
Mean Downtime
Mean downtime measures the average amount of time an asset remains unavailable after a failure.
It may include:
- Fault reporting
- Technician response
- Diagnosis
- Waiting for parts
- Repair
- Testing
- Restart approval
A high mean downtime may indicate poor spare parts availability, weak troubleshooting procedures, inadequate staffing, or slow work order approvals.
Repair and Response KPIs
These metrics evaluate how efficiently maintenance teams respond to and resolve equipment issues.
Mean Time to Repair
Mean Time to Repair, or MTTR, measures the average time required to repair a failed asset and restore it to operation.
The formula is:
MTTR = Total Repair Time ÷ Number of Repairs
MTTR may include:
- Diagnosis
- Repair
- Component replacement
- Testing
- Restart
- Documentation
A lower MTTR generally indicates faster maintenance response and more efficient repair processes.
MTTR can be improved through:
- Better troubleshooting guides
- Technician training
- Critical spare parts availability
- Mobile access to work orders
- Accurate maintenance history
- Standard repair procedures
- Faster escalation processes
Mean Time to Respond
Mean Time to Respond measures the average time between when a maintenance request is submitted and when a technician begins responding.
The formula is:
Mean Time to Respond = Total Response Time ÷ Number of Requests
This metric is especially useful for:
- Facilities maintenance
- Helpdesk maintenance
- Healthcare equipment support
- Hospitality maintenance
- Multi-location operations
- Emergency work requests
Long response times may indicate poor prioritization, inadequate staffing, excessive travel, or unclear assignment rules.
Mean Time to Detect
Mean Time to Detect measures how long it takes to identify a developing fault or equipment failure.
Condition monitoring, automated alarms, operator inspections, and predictive analytics can help reduce detection time.
Faster detection often prevents:
- Secondary equipment damage
- Longer downtime
- Safety incidents
- More expensive repairs
- Production disruption
Mean Time to Acknowledge
Mean Time to Acknowledge measures how quickly a technician, supervisor, or maintenance team confirms receipt of a work request.
This KPI helps organizations measure communication and responsiveness before the repair begins.
Preventive Maintenance KPIs
Preventive maintenance KPIs show whether planned maintenance activities are being completed effectively and on time.
Preventive Maintenance Compliance
Preventive Maintenance Compliance measures the percentage of preventive maintenance tasks completed by their due date.
The formula is:
PM Compliance = Preventive Tasks Completed on Time ÷ Preventive Tasks Due × 100
Low compliance may result from:
- Overloaded schedules
- Missing spare parts
- Poor planning
- Technician shortages
- Production refusing equipment access
- Unrealistic maintenance frequencies
- Frequent emergency work
High compliance is important, but organizations should also ensure that preventive tasks are useful and properly designed.
Planned Maintenance Percentage
Planned Maintenance Percentage measures the proportion of maintenance labor hours spent on planned work.
The formula is:
Planned Maintenance Percentage = Planned Maintenance Hours ÷ Total Maintenance Hours × 100
A higher percentage generally indicates more proactive maintenance.
However, planned work should still be prioritized based on risk and asset criticality.
Preventive Maintenance Effectiveness
Preventive Maintenance Effectiveness evaluates whether scheduled maintenance actually reduces failures.
It may be measured by comparing:
- Failure frequency before and after preventive maintenance
- Breakdown rate by asset
- Repeat failure trends
- MTBF improvements
- Maintenance cost changes
- Inspection findings
Completing preventive tasks on time is not enough if equipment continues to fail frequently.
Preventive Maintenance Yield
Preventive Maintenance Yield measures how often preventive maintenance identifies a fault requiring corrective action.
A very low yield may indicate that tasks are unnecessary or too frequent. A very high yield may indicate that maintenance intervals are too long.
Percentage of Preventive Work Orders
This metric shows how much of the total maintenance workload comes from preventive maintenance.
The formula is:
Preventive Work Order Percentage = Preventive Work Orders ÷ Total Work Orders × 100
It helps organizations understand the balance between planned and reactive maintenance.
Work Order Performance KPIs
Work order metrics evaluate how efficiently maintenance requests are created, assigned, completed, and closed.
Work Order Completion Rate
Work Order Completion Rate measures the percentage of assigned work orders completed within a defined period.
The formula is:
Work Order Completion Rate = Completed Work Orders ÷ Assigned Work Orders × 100
A low completion rate may be caused by:
- Poor planning
- Missing parts
- Technician shortages
- Excessive workload
- Incorrect priorities
- Equipment access issues
- Incomplete work instructions
On-Time Work Order Completion
This KPI measures the percentage of work orders completed by their target date.
The formula is:
On-Time Completion = Work Orders Completed on Time ÷ Work Orders Due × 100
It helps maintenance managers evaluate scheduling accuracy and execution discipline.
Work Order Cycle Time
Work Order Cycle Time measures the total time from request creation to work order closure.
It may include:
- Approval time
- Planning time
- Scheduling delay
- Technician response
- Repair time
- Testing
- Closure
Long cycle times may indicate delays in approval, parts availability, scheduling, or documentation.
Work Order Reopen Rate
Work Order Reopen Rate measures how often completed work orders must be reopened because the issue was not fully resolved.
A high reopen rate may indicate:
- Incomplete repairs
- Incorrect diagnosis
- Poor testing
- Missing technician notes
- Low-quality parts
- Premature closure
Emergency Work Order Rate
Emergency Work Order Rate measures the percentage of maintenance work classified as an emergency.
The formula is:
Emergency Work Order Rate = Emergency Work Orders ÷ Total Work Orders × 100
A rising emergency rate usually indicates that preventive, predictive, or inspection programs require improvement.
Maintenance Backlog and Scheduling KPIs
These metrics help maintenance leaders evaluate future workload, scheduling quality, and resource availability.
Maintenance Backlog
Maintenance backlog measures the total amount of approved but incomplete maintenance work.
It may be measured in:
- Number of work orders
- Labor hours
- Crew days
- Crew weeks
- Estimated cost
Backlog should be separated into:
- Requested work
- Approved work
- Planned work
- Ready-to-schedule work
- Deferred work
- Shutdown work
This helps managers understand where delays are occurring.
Backlog Age
Backlog Age measures how long work orders remain open.
Backlog may be grouped into categories such as:
- Less than 7 days
- 7 to 30 days
- 31 to 60 days
- 61 to 90 days
- More than 90 days
Older work orders should be reviewed to confirm that they are still necessary and correctly prioritized.
Schedule Compliance
Schedule Compliance measures how much scheduled maintenance work was completed during the planned period.
The formula is:
Schedule Compliance = Scheduled Work Completed ÷ Total Scheduled Work × 100
Low compliance may result from:
- Emergency breakdowns
- Poor labor estimates
- Missing spare parts
- Asset unavailability
- Scope changes
- Contractor delays
- Overloaded schedules
Ready Backlog
Ready Backlog measures the amount of fully planned work available for scheduling.
A work order should only be considered ready when it has:
- A clear scope
- Required spare parts
- Tools
- Labor estimates
- Safety requirements
- Technical instructions
- Necessary approvals
A healthy ready backlog helps prevent technicians from waiting for work.
Planning Accuracy
Planning Accuracy compares estimated labor, duration, parts, and costs with actual results.
It helps maintenance planners improve future job plans.
Large differences may indicate:
- Incomplete job scope
- Poor historical data
- Unexpected equipment condition
- Incorrect labor estimates
- Missing tools or parts
- Technician skill differences
Maintenance Cost KPIs
Cost metrics help organizations evaluate whether maintenance spending is controlled and producing value.
Total Maintenance Cost
Total Maintenance Cost includes all expenses associated with maintaining assets.
It may include:
- Internal labor
- Contractor labor
- Spare parts
- Consumables
- Tools
- Equipment rentals
- Software
- Training
- Emergency shipping
- Inspection services
- Planned shutdowns
Total maintenance cost should be reviewed by location, asset, department, and maintenance type.
Maintenance Cost per Asset
This KPI measures how much maintenance is spent on an individual asset.
The formula is:
Maintenance Cost per Asset = Total Maintenance Cost for Asset ÷ Reporting Period
It helps identify:
- High-cost assets
- Poorly performing equipment
- Replacement candidates
- Excessive spare parts usage
- Repeated failures
Maintenance Cost as a Percentage of Replacement Asset Value
This metric compares annual maintenance spending with the replacement value of assets.
The formula is:
Maintenance Cost Percentage = Annual Maintenance Cost ÷ Replacement Asset Value × 100
It helps organizations assess whether maintaining an asset remains financially reasonable.
A high percentage may indicate that replacement or redesign should be considered.
Labor Cost Percentage
Labor Cost Percentage measures how much of the maintenance budget is spent on internal and external labor.
The formula is:
Labor Cost Percentage = Maintenance Labor Cost ÷ Total Maintenance Cost × 100
This KPI helps organizations evaluate overtime, contractor use, staffing, and technician productivity.
Spare Parts Cost Percentage
Spare Parts Cost Percentage measures the proportion of maintenance spending used for replacement parts and materials.
The formula is:
Spare Parts Cost Percentage = Spare Parts Cost ÷ Total Maintenance Cost × 100
A rising percentage may indicate recurring failures, poor parts quality, inventory waste, or aging equipment.
Emergency Maintenance Cost
Emergency Maintenance Cost measures the total cost of urgent and unplanned repairs.
It may include:
- Overtime
- Expedited shipping
- Contractor callouts
- Lost production
- Temporary equipment
- Secondary damage
Tracking this KPI helps demonstrate the financial value of preventive and predictive maintenance.
Maintenance Cost Avoidance
Cost avoidance estimates the expenses prevented through maintenance action.
Examples include:
- Avoided breakdowns
- Extended asset life
- Reduced overtime
- Lower energy consumption
- Fewer emergency part purchases
- Avoided regulatory penalties
- Reduced production loss
Cost avoidance should be based on documented assumptions and historical data rather than unsupported estimates.
Technician Productivity KPIs
Technician metrics help organizations understand how effectively maintenance labor is being used.
Wrench Time
Wrench Time measures the percentage of a technician’s workday spent performing hands-on maintenance.
It excludes time spent:
- Waiting for parts
- Traveling
- Searching for tools
- Waiting for approvals
- Attending meetings
- Completing paperwork
- Waiting for equipment access
Low wrench time may indicate planning, scheduling, inventory, or coordination problems rather than poor technician performance.
Technician Utilization
Technician Utilization measures how much available labor time is assigned to productive maintenance work.
The formula is:
Technician Utilization = Productive Labor Hours ÷ Available Labor Hours × 100
Organizations should avoid treating 100% utilization as the goal because technicians need time for safety meetings, training, travel, and unexpected work.
Work Orders Completed per Technician
This metric compares the number of completed work orders by technician, team, shift, or location.
It should be interpreted carefully because work orders vary greatly in complexity and duration.
First-Time Fix Rate
First-Time Fix Rate measures the percentage of maintenance issues resolved during the first technician visit.
The formula is:
First-Time Fix Rate = Issues Resolved on First Visit ÷ Total Issues × 100
A higher first-time fix rate may indicate:
- Better diagnosis
- Accurate work order information
- Improved spare parts availability
- Better technician training
- Stronger maintenance history
Overtime Percentage
Overtime Percentage measures the share of maintenance labor completed outside standard working hours.
The formula is:
Overtime Percentage = Overtime Hours ÷ Total Labor Hours × 100
Consistently high overtime may indicate understaffing, excessive emergency maintenance, poor scheduling, or shutdown planning problems.
Spare Parts and Inventory KPIs
Maintenance performance often depends on having the right spare parts available at the right time.
Spare Parts Stockout Rate
Stockout Rate measures how often required maintenance parts are unavailable.
A high stockout rate can increase:
- Downtime
- Work order delays
- Emergency purchasing
- Technician waiting time
- Shipping costs
Inventory Turnover
Inventory Turnover measures how frequently spare parts inventory is used and replaced.
The formula is:
Inventory Turnover = Annual Spare Parts Usage ÷ Average Spare Parts Inventory Value
Very low turnover may indicate excess inventory or obsolete parts. Very high turnover may increase the risk of stockouts.
Critical Spare Availability
This KPI measures whether identified critical spare parts are available when required.
Critical spares should be selected based on:
- Asset criticality
- Failure impact
- Supplier lead time
- Replacement cost
- Part availability
- Equipment redundancy
Obsolete Inventory Percentage
Obsolete Inventory Percentage measures how much spare parts stock is no longer required or usable.
The formula is:
Obsolete Inventory Percentage = Obsolete Inventory Value ÷ Total Inventory Value × 100
Obsolete stock can result from equipment replacement, poor purchasing practices, duplicated inventory, or outdated asset records.
Parts Usage Accuracy
Parts Usage Accuracy measures whether spare parts removed from inventory are correctly linked to work orders and assets.
Accurate records improve cost analysis, replenishment, and failure reporting.
Safety and Compliance KPIs
Maintenance programs must also support safe and compliant operations.
Safety-Related Work Order Completion
This KPI measures whether safety-critical maintenance work is completed by its due date.
Examples include:
- Fire system inspections
- Emergency lighting tests
- Safety guard repairs
- Electrical inspections
- Pressure system checks
- Elevator maintenance
Inspection Compliance
Inspection Compliance measures the percentage of mandatory inspections completed on time.
The formula is:
Inspection Compliance = Inspections Completed on Time ÷ Inspections Due × 100
Audit Finding Closure Rate
Audit Finding Closure Rate measures how quickly maintenance-related audit findings are resolved.
The formula is:
Closure Rate = Audit Findings Closed ÷ Total Findings × 100
Permit and Checklist Compliance
This metric measures whether technicians follow required permits, lockout procedures, checklists, and safety documentation.
Maintenance-Related Incident Rate
Maintenance-Related Incident Rate tracks safety events connected to equipment condition, repair activities, or missed maintenance.
A rising rate may indicate weak maintenance procedures, inadequate inspections, or poor training.
Asset Performance KPIs
Asset performance metrics connect maintenance activity with operational outcomes.
Asset Utilization
Asset Utilization measures how much an asset is used compared with its available capacity.
The formula is:
Asset Utilization = Actual Operating Time ÷ Available Operating Time × 100
Low utilization may indicate excess equipment, production constraints, poor scheduling, or asset performance problems.
Asset Performance Index
Organizations may create a combined score using:
- Reliability
- Availability
- Maintenance cost
- Downtime
- Failure frequency
- Utilization
- Safety performance
The score helps compare assets with different maintenance histories.
Lifecycle Cost
Lifecycle Cost measures the total cost of owning and operating an asset throughout its life.
It may include:
- Purchase
- Installation
- Maintenance
- Energy
- Spare parts
- Downtime
- Compliance
- Disposal
Lifecycle cost supports repair-versus-replace decisions.
Remaining Useful Life
Remaining Useful Life estimates how long an asset or component can continue operating before replacement or major overhaul is required.
It may be based on:
- Age
- Usage
- Condition
- Failure history
- Sensor data
- Manufacturer recommendations
- Predictive analytics
How to Build an Effective Maintenance Reporting System
A maintenance reporting process should deliver useful information without overwhelming teams with unnecessary data.
Define Clear Business Objectives
Start by identifying what the organization wants to improve.
Examples include:
- Reduce unplanned downtime
- Improve asset reliability
- Control maintenance cost
- Increase schedule compliance
- Reduce emergency work
- Improve preventive maintenance completion
- Reduce spare parts stockouts
- Improve technician productivity
Metrics should be selected based on these goals.
Standardize KPI Definitions
Every department should use the same definition, formula, data source, and reporting period.
For example, organizations should clearly define:
- What counts as a failure
- When downtime begins and ends
- What qualifies as planned maintenance
- When a work order is complete
- Which costs are included
- How emergency work is classified
Without standard definitions, reports may become inconsistent and misleading.
Improve Data Quality
Maintenance reports are only as reliable as the underlying data.
Important data fields include:
- Asset identification
- Work order type
- Failure code
- Priority
- Labor time
- Downtime
- Parts used
- Maintenance cost
- Completion date
- Root cause
- Technician notes
Mandatory fields and standardized codes improve reporting accuracy.
Assign KPI Ownership
Each KPI should have an owner responsible for:
- Data accuracy
- Target setting
- Performance review
- Corrective actions
- Reporting frequency
Ownership prevents metrics from becoming unused dashboard figures.
Set Realistic Targets
Targets should consider:
- Current performance
- Asset criticality
- Industry requirements
- Equipment age
- Available resources
- Operational conditions
- Historical trends
Targets should be challenging but achievable.
Choose the Right Reporting Frequency
Different KPIs require different review periods.
Daily Reporting
Useful for:
- Emergency work orders
- Critical downtime
- Safety issues
- Technician workload
- Breakdown status
Weekly Reporting
Useful for:
- Schedule compliance
- Work order completion
- Backlog
- Preventive maintenance compliance
- Labor capacity
Monthly Reporting
Useful for:
- MTBF
- MTTR
- Maintenance cost
- Availability
- Repeat failures
- Spare parts consumption
Quarterly Reporting
Useful for:
- Reliability trends
- Budget performance
- Asset replacement planning
- Contractor performance
- Lifecycle cost
- Maintenance strategy reviews
What Should a Maintenance Dashboard Include?
A maintenance dashboard should provide a clear summary of performance.
Common dashboard sections include:
- Open work orders
- Overdue work orders
- Emergency work orders
- Preventive maintenance compliance
- Schedule compliance
- Maintenance backlog
- Asset downtime
- MTBF
- MTTR
- Asset availability
- Maintenance cost
- High-cost assets
- Repeat failures
- Technician workload
- Spare parts stockouts
- Safety-related maintenance
The dashboard should allow users to filter data by:
- Location
- Department
- Asset category
- Maintenance type
- Technician
- Priority
- Date
- Work order status
Common Maintenance Reporting Mistakes
Organizations may collect large amounts of data without gaining useful insights.
Common mistakes include:
- Tracking too many KPIs
- Using inconsistent definitions
- Relying on incomplete work orders
- Measuring activity without outcomes
- Ignoring asset criticality
- Comparing unrelated assets
- Reporting figures without trends
- Failing to assign KPI ownership
- Using unrealistic targets
- Focusing only on cost reduction
- Ignoring data quality
- Failing to act on poor performance
- Using spreadsheets that are not updated consistently
The purpose of reporting is not simply to produce charts. It is to support better maintenance decisions.
Best Practices for Maintenance KPIs and Reporting
Use a Balanced Set of Metrics
Track reliability, cost, downtime, planning, safety, and productivity rather than relying on one indicator.
Compare Trends Over Time
Monthly and quarterly trends often provide more value than isolated figures.
Segment the Data
Analyze KPIs by asset, site, department, maintenance type, and technician group.
Focus on Critical Assets
The same target may not be appropriate for both critical production machinery and low-value office equipment.
Review Root Causes
When a KPI declines, investigate why rather than treating the metric itself as the problem.
Connect KPIs to Actions
Each report should identify:
- What changed
- Why it changed
- What action is required
- Who owns the action
- When it will be completed
Keep Reports Easy to Understand
Executives may require summary trends, while planners and technicians need detailed operational data.
Automate Reporting
Automated dashboards reduce manual spreadsheet work and improve reporting consistency.
How Maintenance Management Software Improves KPI Reporting
Maintenance management software centralizes asset data, work orders, maintenance history, downtime, labor, and spare parts information.
It can help organizations:
- Track maintenance KPIs automatically
- Generate real-time dashboards
- Record asset downtime
- Measure MTBF and MTTR
- Monitor preventive maintenance compliance
- Track planned and emergency work
- Analyze maintenance costs
- Review work order backlogs
- Monitor technician workload
- Track spare parts consumption
- Identify repeat failures
- Compare locations and asset categories
- Export reports for audits and management reviews
- Schedule recurring reports
- Improve data accuracy
Automated reporting reduces the time required to collect information from spreadsheets, paper forms, emails, and disconnected systems.
Why Choose Asset Infinity for Maintenance Reporting?
Asset Infinity helps organizations manage maintenance operations and monitor key performance indicators through one centralized platform.
With Asset Infinity, businesses can:
- Create and manage digital work orders
- Automate preventive maintenance schedules
- Record asset downtime and failure history
- Track MTBF and MTTR
- Monitor work order status and completion
- Measure preventive maintenance compliance
- Review overdue and emergency tasks
- Track labor, repair, and spare parts costs
- Monitor technician productivity
- Analyze maintenance backlogs
- Manage spare parts and consumables
- Access real-time dashboards
- Generate maintenance reports
- Compare performance across locations
- Maintain audit-ready records
- Access maintenance information through mobile devices
By connecting asset records, work orders, technicians, parts, and costs, Asset Infinity helps maintenance leaders make better decisions based on accurate operational data.
How to Start Measuring Maintenance Performance
Organizations can begin improving maintenance reporting through the following steps.
Step 1: Define the Objective
Choose a clear goal, such as reducing downtime or improving preventive maintenance compliance.
Step 2: Select a Small Number of KPIs
Start with relevant metrics such as:
- MTBF
- MTTR
- Unplanned downtime
- Preventive maintenance compliance
- Schedule compliance
- Maintenance cost
- Emergency work order rate
Step 3: Standardize Data Collection
Define required work order fields, failure codes, downtime rules, and cost categories.
Step 4: Establish Current Performance
Measure the existing baseline before setting improvement targets.
Step 5: Set KPI Targets
Create realistic targets based on asset criticality and operational requirements.
Step 6: Review Results Regularly
Use daily, weekly, and monthly reports based on the type of metric.
Step 7: Investigate Performance Gaps
Identify root causes when results fall below target.
Step 8: Implement Improvement Actions
Assign owners, deadlines, and follow-up reviews.
Step 9: Refine the KPIs
Remove metrics that do not support decision-making and add new ones only when necessary.
Conclusion
Maintenance KPIs and reporting provide the visibility organizations need to improve asset reliability, reduce downtime, control costs, and increase maintenance efficiency.
Reliability metrics such as MTBF and failure rate show how consistently equipment performs. Downtime and availability metrics reveal the operational impact of maintenance issues. Work order, backlog, scheduling, and preventive maintenance KPIs help teams improve planning and execution.
Cost metrics show where maintenance budgets are being used, while technician and spare parts KPIs reveal delays, inefficiencies, and resource constraints.
However, collecting data alone does not improve maintenance. Organizations must define clear KPI standards, maintain accurate records, review trends, investigate root causes, and connect every report to meaningful action.
With maintenance management software such as Asset Infinity, businesses can centralize asset and maintenance information, automate KPI tracking, create real-time dashboards, and make informed decisions that improve performance across the asset lifecycle.
Frequently Asked Questions
1. What are the most important maintenance KPIs?
The most important maintenance KPIs commonly include MTBF, MTTR, asset availability, unplanned downtime, preventive maintenance compliance, schedule compliance, maintenance backlog, emergency work order rate, maintenance cost, and repeat failure rate.
2. What is the difference between MTBF and MTTR?
MTBF measures the average operating time between equipment failures, while MTTR measures the average time required to repair equipment and return it to operation.
3. How is preventive maintenance compliance calculated?
Preventive maintenance compliance is calculated by dividing the number of preventive maintenance tasks completed on time by the total number of tasks due, then multiplying the result by 100.
4. How often should maintenance KPIs be reviewed?
Operational KPIs such as emergency work orders and downtime may be reviewed daily, while schedule compliance and backlog can be reviewed weekly. Reliability, cost, and performance trends are commonly reviewed monthly or quarterly.
5. How does maintenance software improve KPI reporting?
Maintenance software automatically collects data from assets, work orders, technicians, downtime records, and spare parts. It then converts this information into dashboards and reports for faster, more accurate performance monitoring.