


In this article
- What Are Helpdesk Metrics?
- What Is SLA Management?
- Why Helpdesk Metrics and SLA Management Matter
- Difference Between a Metric, KPI and SLA
- What Is TAT in Helpdesk Management?
- Main Categories of Helpdesk Metrics
- Essential Helpdesk Ticket KPIs
- Leading and Lagging Helpdesk Metrics
- How to Design Helpdesk SLAs
- Response SLA vs Resolution SLA
- SLA Timer Management
- SLA Breach Management
- How to Measure Agent Performance Fairly
- Risks of Using a Single Agent KPI
- Helpdesk Dashboard Design
- Helpdesk Reporting Best Practices
- Average vs Median in Helpdesk Reporting
- Common Helpdesk Reporting Mistakes
- Best Practices for Helpdesk Metrics and SLA Management
- Improving Helpdesk Turnaround Time
- How Helpdesk Software Supports SLA Management
- How Helpdesk Software Improves KPI Reporting
- Helpdesk Metrics for Internal Support Teams
- Helpdesk Metrics for Customer Support Teams
- Helpdesk Metrics Across Departments
- Industry Use Cases
- How to Implement Helpdesk Metrics and SLA Management
- Why Choose Asset Infinity for Helpdesk Metrics and SLA Management?
- Conclusion
- Frequently Asked Questions
Support teams handle a continuous flow of requests, incidents, complaints, technical issues, service needs, and operational problems.
Receiving and resolving tickets is only one part of running an effective helpdesk. Organizations must also understand how quickly requests are acknowledged, how long they remain open, whether service commitments are being met, which issues are repeated, and whether users are satisfied with the outcome.
Without reliable performance data, managers may know that the team is busy but may not understand where delays occur or why backlogs continue to grow.
A high ticket closure count does not always indicate good service. Tickets may be closed without proper resolution, complex issues may be ignored in favor of simpler requests, or users may wait too long for the first response.
Effective helpdesk metrics and SLA management provide a structured way to measure support performance, maintain service commitments, identify bottlenecks, balance workloads, improve accountability, and deliver a more consistent experience.
This guide explains the most important helpdesk KPIs, service-level agreements, turnaround time, response metrics, backlog reporting, agent performance indicators, dashboard design, common reporting mistakes, and best practices.
What Are Helpdesk Metrics?
Helpdesk metrics are measurable indicators used to evaluate the volume, speed, efficiency, quality, and outcome of support activities.
They help organizations answer questions such as:
- How many tickets are being created?
- How quickly are tickets acknowledged?
- How long does resolution take?
- Which requests are overdue?
- How often are service targets missed?
- Which issues are repeated?
- How many tickets are reopened?
- Which teams have the largest backlog?
- Are users satisfied with the support?
- Is the helpdesk improving over time?
Metrics may be reviewed by:
- Support managers
- Operations leaders
- IT managers
- Facilities teams
- Maintenance teams
- Customer service leaders
- Department heads
- Senior management
- Compliance teams
The purpose of measurement is not simply to create reports. Metrics should help teams identify problems and improve service delivery.
What Is SLA Management?
SLA management is the process of defining, monitoring, reporting, and improving service-level commitments.
An SLA, or service-level agreement, establishes the expected level of service between a support provider and a user, customer, department, or business unit.
An SLA may define:
- First response time
- Acknowledgement time
- Resolution time
- Update frequency
- Service availability
- Escalation requirements
- Support hours
- Priority levels
- Responsibilities
- Exclusions
SLA management ensures that these commitments are clear, measurable, and monitored consistently.
Why Helpdesk Metrics and SLA Management Matter
Support teams often operate under pressure from growing ticket volumes, limited staff, complex requests, and increasing user expectations.
Without measurement and service targets, teams may struggle with:
- Slow response
- Unclear priorities
- Growing backlogs
- Missed deadlines
- Uneven agent workloads
- Repeated issues
- Poor user communication
- Inconsistent service
- Difficult management reporting
- Weak accountability
Helpdesk metrics and SLA management help organizations:
- Set clear service expectations
- Prioritize urgent requests
- Track support speed
- Monitor service quality
- Identify overloaded teams
- Improve staffing decisions
- Reduce ticket backlog
- Detect recurring problems
- Improve customer and employee satisfaction
- Support continuous improvement
- Maintain audit-ready service records
Difference Between a Metric, KPI and SLA
These terms are related but serve different purposes.
Helpdesk Metric
A metric is any measurable support activity.
Examples include:
- Total tickets created
- Number of open tickets
- Average ticket age
- Number of replies
- Tickets by channel
Helpdesk KPI
A key performance indicator is a metric that is directly connected to an important support objective.
Examples include:
- SLA compliance rate
- First response time
- First contact resolution
- Customer satisfaction
- Ticket reopen rate
Not every metric should be treated as a KPI.
Service-Level Agreement
An SLA is a defined service commitment.
For example:
- Critical tickets must receive a response within 15 minutes.
- High-priority tickets must be resolved within four hours.
- Standard requests must receive an update every business day.
The KPI measures performance, while the SLA defines the expected target.
What Is TAT in Helpdesk Management?
TAT stands for turnaround time.
In helpdesk operations, turnaround time refers to the total time taken to complete a ticket, request, or support process.
TAT may be measured from:
- Ticket creation to resolution
- Ticket assignment to completion
- Request acknowledgement to closure
- Approval submission to final action
- Work order creation to completion
The exact definition should be standardized because different teams may calculate TAT differently.
TAT vs Response Time
Response time measures how long it takes the support team to reply or begin action.
TAT measures how long it takes to complete the full request.
For example:
- A ticket is created at 9:00 a.m.
- An agent responds at 9:20 a.m.
- The issue is resolved at 1:00 p.m.
The first response time is 20 minutes.
The turnaround time is four hours.
TAT vs Resolution Time
In many organizations, TAT and resolution time are used interchangeably.
However, some teams define TAT as the complete process time, including approvals, waiting, and closure. Resolution time may refer only to the time until the technical solution is provided.
The organization should document its definition to ensure accurate reporting.
Main Categories of Helpdesk Metrics
Helpdesk performance can be measured across several categories.
Volume Metrics
These show how much work enters the helpdesk.
Examples include:
- Total tickets
- Tickets by category
- Tickets by location
- Tickets by channel
- Tickets by priority
- Tickets by customer
- Tickets by department
Speed Metrics
These measure how quickly the team responds and resolves requests.
Examples include:
- First response time
- Acknowledgement time
- Resolution time
- Turnaround time
- Average ticket age
Quality Metrics
These evaluate the effectiveness of the service.
Examples include:
- First contact resolution
- Ticket reopen rate
- Customer satisfaction
- Repeat ticket rate
- Resolution accuracy
Productivity Metrics
These show how efficiently agents and teams handle work.
Examples include:
- Tickets resolved per agent
- Average handling time
- Agent utilization
- Workload distribution
- Productivity by shift
SLA Metrics
These measure performance against service commitments.
Examples include:
- SLA compliance rate
- SLA breach rate
- Response SLA compliance
- Resolution SLA compliance
- Breaches by priority
Backlog Metrics
These show unresolved workload.
Examples include:
- Total backlog
- Backlog by age
- Backlog by priority
- Backlog by team
- Overdue tickets
Satisfaction Metrics
These measure the experience of the requester.
Examples include:
- Customer satisfaction score
- Employee satisfaction score
- Net promoter score
- Support effort score
- Feedback response rate
Essential Helpdesk Ticket KPIs
1. Total Ticket Volume
Total ticket volume measures the number of tickets created during a defined period.
It may be tracked daily, weekly, monthly, quarterly, or annually.
Ticket volume can be segmented by:
- Category
- Department
- Location
- Channel
- Product
- Asset
- Priority
- Customer type
- Requester group
A rising ticket volume is not always negative. It may indicate business growth, increased system adoption, or improved reporting.
However, a sudden increase in a specific category may reveal a service problem.
2. Tickets Created vs Tickets Resolved
This metric compares incoming tickets with completed tickets.
When the number of created tickets is consistently higher than the number resolved, the backlog will grow.
Net Ticket Growth = Tickets Created − Tickets Resolved
For example:
If 1,000 tickets are created in a month and 850 are resolved, the backlog grows by 150 tickets.
3. First Response Time
First response time measures how long a requester waits before receiving the first meaningful response.
Average First Response Time = Total First Response Time ÷ Number of Tickets
An automatic acknowledgement may confirm receipt, but it should not always be treated as a meaningful response.
A meaningful first response may include:
- Confirmation that an agent is reviewing the issue
- A request for additional information
- Initial troubleshooting
- A status update
- A proposed next step
4. Acknowledgement Time
Acknowledgement time measures how quickly the support team confirms that the request has been received.
This is useful when acknowledgement and first response are treated as separate service targets.
For example:
- Acknowledgement target: 10 minutes
- First meaningful response target: 30 minutes
5. Average Resolution Time
Average resolution time measures how long it takes to resolve tickets.
Average Resolution Time = Total Resolution Time ÷ Number of Resolved Tickets
It should be reviewed by:
- Priority
- Category
- Agent
- Team
- Location
- Request type
A single overall average may hide significant differences between simple and complex tickets.
6. Turnaround Time
Turnaround time measures the complete time required to finish a request.
Average TAT = Total Turnaround Time ÷ Number of Completed Tickets
TAT may include:
- Assignment
- Investigation
- Approval
- Vendor work
- Repair
- Requester confirmation
- Closure
TAT is especially useful for service requests that require multiple steps.
7. First Contact Resolution Rate
First contact resolution measures how many tickets are resolved during the initial interaction.
First Contact Resolution Rate = Tickets Resolved at First Contact ÷ Total Resolved Tickets × 100
A high first contact resolution rate may indicate:
- Strong agent knowledge
- Good documentation
- Effective knowledge management
- Clear support processes
- Appropriate access to tools
However, teams should not rush resolution simply to improve the metric.
8. SLA Compliance Rate
SLA compliance measures the percentage of tickets completed within the defined service target.
SLA Compliance Rate = Tickets Meeting SLA ÷ Total SLA-Eligible Tickets × 100
It may be calculated separately for:
- First response
- Acknowledgement
- Resolution
- Update frequency
- Closure
9. SLA Breach Rate
SLA breach rate measures the percentage of tickets that fail to meet the target.
SLA Breach Rate = Tickets Breaching SLA ÷ Total SLA-Eligible Tickets × 100
Breaches should be analyzed by:
- Priority
- Category
- Team
- Agent
- Location
- Customer
- Root cause
10. Ticket Backlog
Ticket backlog is the number of unresolved tickets remaining at a specific time.
A backlog may include tickets that are:
- New
- Assigned
- In progress
- Pending
- Escalated
- Overdue
Backlog should be reviewed by age and priority rather than only total count.
11. Average Ticket Age
Average ticket age measures how long currently open tickets have remained unresolved.
Average Ticket Age = Total Age of Open Tickets ÷ Number of Open Tickets
A rising average may indicate capacity problems, weak prioritization, or workflow delays.
12. Ticket Reopen Rate
Ticket reopen rate measures the percentage of resolved tickets that are reopened.
Ticket Reopen Rate = Reopened Tickets ÷ Resolved Tickets × 100
A high reopen rate may indicate:
- Incomplete resolution
- Poor diagnosis
- Weak communication
- Premature closure
- Recurring technical issues
- Incorrect requester expectations
13. Escalation Rate
Escalation rate measures the percentage of tickets transferred to higher support levels or management.
Escalation Rate = Escalated Tickets ÷ Total Tickets × 100
A high rate may indicate:
- Insufficient frontline skills
- Poor knowledge articles
- Complex tickets
- Weak assignment rules
- Limited agent permissions
14. Ticket Transfer Rate
Ticket transfer rate measures how often tickets are reassigned between teams or agents.
Frequent transfers may increase resolution time and frustrate requesters.
15. Abandonment Rate
Abandonment rate may apply to phone, chat, or portal interactions where users leave before receiving support.
A high abandonment rate may indicate long wait times or poor channel performance.
16. Repeat Ticket Rate
Repeat ticket rate measures how often users report the same problem again.
Repeated tickets may indicate:
- Temporary fixes
- Poor root cause analysis
- Incomplete knowledge
- Product or process defects
- Weak preventive action
17. Customer Satisfaction Score
Customer satisfaction score is collected through a survey after ticket resolution.
A typical question may ask users to rate the support experience.
CSAT = Positive Responses ÷ Total Responses × 100
CSAT should be reviewed alongside response and resolution metrics.
18. Customer Effort Score
Customer effort score measures how easy or difficult it was for the requester to receive support.
It may ask:
“How easy was it to get your issue resolved?”
Low effort often contributes to better satisfaction and loyalty.
19. Net Promoter Score
Net promoter score measures how likely users are to recommend the service.
It is more commonly used for broader customer relationships than individual ticket performance.
20. Tickets Resolved per Agent
This metric measures how many tickets each agent resolves during a period.
It can help with workload planning, but it should not be used alone.
An agent handling complex tickets may resolve fewer requests than one managing password resets or routine queries.
21. Agent Utilization
Agent utilization measures the proportion of available time spent on productive support activities.
Activities may include:
- Ticket resolution
- User communication
- Investigation
- Documentation
- Knowledge creation
- Escalation
- Training
Excessively high utilization may lead to burnout and reduced quality.
22. Average Handling Time
Average handling time measures the active time spent working on each ticket.
It may include:
- Communication
- Investigation
- Troubleshooting
- Documentation
- Follow-up
It differs from resolution time because it may exclude waiting periods.
23. Ticket Closure Rate
Ticket closure rate measures the proportion of tickets closed during a defined period.
Ticket Closure Rate = Tickets Closed ÷ Total Tickets Managed × 100
Closure quality should be reviewed alongside the reopen rate.
24. Self-Service Resolution Rate
Self-service resolution rate measures how many users resolve issues through the knowledge base or portal without creating a ticket.
A strong self-service rate may reduce repetitive support work.
25. Knowledge Base Deflection Rate
Knowledge deflection measures how many potential tickets are avoided after users view support content.
The measurement method should be defined carefully because users may read an article and still create a ticket.
26. Cost per Ticket
Cost per ticket estimates the average cost of providing support.
Cost per Ticket = Total Helpdesk Operating Cost ÷ Number of Resolved Tickets
Operating cost may include:
- Salaries
- Benefits
- Software
- Training
- Infrastructure
- Contractor support
- Management overhead
27. Ticket Automation Rate
Ticket automation rate measures the percentage of tickets or actions processed automatically.
Automated actions may include:
- Categorization
- Assignment
- Notification
- Priority setting
- Escalation
- Closure
- Survey distribution
28. Pending Time
Pending time measures how long a ticket remains paused.
A ticket may be pending because the team is waiting for:
- Requester information
- Vendor response
- Approval
- Spare parts
- Scheduled maintenance
- Third-party action
Pending time should be tracked separately from active work.
Leading and Lagging Helpdesk Metrics
A balanced reporting system should include both leading and lagging indicators.
Leading Metrics
Leading metrics provide early warning of future performance.
Examples include:
- Tickets approaching SLA
- Unassigned ticket count
- Increasing backlog
- Agent workload
- Pending approvals
- Aging tickets
- Declining knowledge usage
These metrics help teams take action before service failure occurs.
Lagging Metrics
Lagging metrics measure past outcomes.
Examples include:
- SLA breach rate
- Average resolution time
- Customer satisfaction
- Reopen rate
- Total support cost
- Monthly ticket closure
They help evaluate whether the process achieved the expected result.
How to Design Helpdesk SLAs
SLAs should reflect business impact, support capacity, and requester expectations.
1. Define the Services Covered
Specify which support services are included.
Examples include:
- IT support
- Facility support
- Maintenance
- Customer service
- Security requests
- HR support
- Procurement support
2. Define Support Hours
State when the service is available.
Examples include:
- Monday to Friday business hours
- Twenty-four-hour support
- Weekend support
- Holiday coverage
- Regional time zones
3. Define Priority Levels
Each priority should have clear criteria.
Critical Priority
Critical tickets may involve:
- Complete service outage
- Major production stoppage
- Serious safety issue
- Business-wide system failure
- Significant security event
These tickets require immediate response.
High Priority
High-priority tickets may involve:
- Multiple users affected
- Major equipment failure
- Significant operational disruption
- Important customer impact
- No practical workaround
Medium Priority
Medium-priority tickets may involve:
- Limited user impact
- Partial service disruption
- Standard operational issue
- Temporary workaround available
Low Priority
Low-priority tickets may involve:
- General questions
- Minor defects
- Routine service requests
- Nonurgent improvements
- Cosmetic issues
4. Define Response Targets
Each priority should have a response target.
For example:
- Critical: 15 minutes
- High: one hour
- Medium: four business hours
- Low: one business day
Targets should be realistic and based on team capacity.
5. Define Resolution Targets
Resolution targets may vary by complexity.
For example:
- Critical: four hours
- High: eight business hours
- Medium: two business days
- Low: five business days
Some services may require separate fulfillment targets.
6. Define Update Frequency
Long-running tickets should include regular updates.
For example:
- Critical incidents: every 30 minutes
- High-priority tickets: every two hours
- Standard requests: once per business day
7. Define Escalation Rules
SLAs should state when escalation occurs.
Triggers may include:
- No acknowledgement
- No assignment
- Response target approaching
- Resolution target breached
- Customer escalation
- Business impact increasing
8. Define Exclusions
Possible exclusions include:
- Planned maintenance
- Unsupported systems
- Waiting for requester response
- Third-party delays
- Force majeure
- Requests outside support scope
Exclusions should be transparent and consistently applied.
Response SLA vs Resolution SLA
These service targets measure different stages.
Response SLA
Response SLA defines how quickly the support team must acknowledge or engage with the ticket.
It helps reassure the requester that the issue is being handled.
Resolution SLA
Resolution SLA defines how quickly the issue should be resolved or the request completed.
This target is usually longer and may depend on priority, complexity, and external dependencies.
A team may meet the response SLA but miss the resolution SLA.
Both should be reported separately.
SLA Timer Management
SLA timers should be configured carefully.
Business Hours
The timer may count only during defined working hours.
For example, a ticket created after business hours may begin counting the next working day.
Holidays
Regional holidays should be included in the service calendar.
Paused Statuses
The SLA timer may pause when waiting for:
- Requester response
- Vendor support
- Management approval
- Scheduled access
- Spare parts
Pause rules should be controlled to prevent misuse.
Multiple Time Zones
Global organizations may require different service calendars by customer, site, or support team.
Reopened Tickets
The organization should define whether the original SLA continues, resets, or creates a new target when a ticket is reopened.
SLA Breach Management
An SLA breach should trigger action rather than only appear in a report.
Common Causes of SLA Breaches
Breaches may be caused by:
- Incorrect assignment
- Ticket volume spikes
- Agent shortage
- Missing information
- Poor prioritization
- Weak escalation
- Vendor delay
- Skill gaps
- Complex approval processes
- Inaccurate category selection
- Excessive ticket transfers
What to Do After an SLA Breach
The team should:
- Review why the target was missed.
- Confirm whether the priority was correct.
- Analyze assignment and workload.
- Review communication history.
- Identify process or resource gaps.
- Inform relevant stakeholders.
- Document the cause.
- Implement corrective action.
- Monitor similar tickets.
Repeated breaches should trigger process improvement.
Ticket Backlog Management
A backlog represents unfinished support work.
A manageable backlog may be normal, but an uncontrolled backlog creates service risk.
Backlog Aging Categories
Tickets may be grouped as:
- Less than one day
- One to three days
- Four to seven days
- Eight to fourteen days
- More than fourteen days
- More than thirty days
The time ranges should match the organization’s support environment.
Causes of Growing Backlog
Backlog may increase because of:
- More tickets than available capacity
- Slow approvals
- Poor assignment
- Weak prioritization
- Repeat incidents
- Missing requester information
- Limited agent skills
- Vendor dependency
- Unclear ownership
- Complex workflows
Backlog Reduction Strategies
Organizations can reduce backlog by:
- Reviewing aging tickets daily
- Prioritizing high-impact requests
- Reassigning overloaded queues
- Closing duplicate tickets
- Automating repetitive work
- Improving knowledge articles
- Creating backlog review sessions
- Escalating blocked tickets
- Training agents
- Solving recurring root causes
How to Measure Agent Performance Fairly
Agent performance should not be evaluated using ticket count alone.
A balanced scorecard may include:
- Tickets resolved
- SLA compliance
- First response time
- Resolution quality
- Reopen rate
- Customer satisfaction
- Documentation quality
- Knowledge contribution
- Team collaboration
- Ticket complexity
- Escalation quality
Managers should account for differences in ticket type, skill level, and workload.
Risks of Using a Single Agent KPI
Overemphasis on one metric may encourage poor behavior.
For example:
- Focusing only on closure count may encourage premature closure.
- Focusing only on handling time may reduce service quality.
- Focusing only on CSAT may encourage agents to avoid difficult cases.
- Focusing only on SLA may lead to incorrect status changes.
Balanced measurement supports better behavior.
Helpdesk Dashboard Design
A helpdesk dashboard should show information that supports action.
Real-Time Operational Dashboard
This may include:
- New tickets
- Unassigned tickets
- Critical tickets
- Tickets approaching SLA
- Current backlog
- Agent workload
- Escalated tickets
- Pending approvals
Management Performance Dashboard
This may include:
- Ticket volume trends
- SLA compliance
- Average response time
- Average resolution time
- First contact resolution
- Reopen rate
- CSAT
- Backlog aging
- Cost per ticket
Executive Dashboard
Senior leaders may need:
- Overall service performance
- Business impact
- Major trends
- Service risk
- Cost
- Customer satisfaction
- Improvement initiatives
- Performance by department or location
Agent Dashboard
Agents may need:
- Assigned tickets
- Priority
- Due dates
- SLA countdown
- Pending responses
- Escalated tickets
- Daily workload
- Personal performance trends
Helpdesk Reporting Best Practices
Define Every Metric Clearly
Each KPI should have a documented definition, formula, source, owner, and reporting frequency.
Use Consistent Time Periods
Compare weekly data with weekly data and monthly data with monthly data.
Segment the Data
Review performance by:
- Priority
- Team
- Category
- Customer
- Location
- Channel
- Asset
- Service
Compare Trends, Not Only Snapshots
One day of poor performance may not indicate a major problem.
Long-term trends provide better insight.
Include Both Speed and Quality
Fast resolution without quality may increase reopen rates.
Exclude Invalid Data
Duplicate, test, spam, and cancelled tickets may need to be excluded.
Review Outliers
A few complex tickets can distort averages.
Use median values and percentile reporting where appropriate.
Add Context to Reports
Explain major events such as:
- System outages
- Staffing changes
- New product launches
- Ticket volume spikes
- Vendor delays
- Seasonal demand
Assign Action Owners
Every major issue identified in a report should have a responsible owner.
Average vs Median in Helpdesk Reporting
Average values can be affected by unusually long or short tickets.
For example:
If four tickets are resolved in one hour and one ticket takes 30 hours, the average rises significantly.
The median shows the middle result and may better represent typical performance.
Organizations may use:
- Average response time
- Median response time
- 90th percentile resolution time
- Maximum ticket age
Using multiple measures provides a clearer view.
Common Helpdesk Reporting Mistakes
Organizations often weaken reporting by:
- Tracking too many metrics
- Using unclear definitions
- Combining different priorities
- Ignoring ticket complexity
- Measuring activity instead of outcomes
- Using closure count as the only productivity measure
- Ignoring customer satisfaction
- Excluding reopened tickets
- Failing to review SLA breach causes
- Using averages without context
- Reporting data without action
- Changing formulas between periods
- Pausing SLA timers incorrectly
- Comparing teams with different responsibilities
Best Practices for Helpdesk Metrics and SLA Management
Select Metrics That Support Business Goals
Choose KPIs that reflect the service experience and operational objectives.
Use a Balanced Scorecard
Measure volume, speed, quality, satisfaction, productivity, and cost.
Set Realistic SLA Targets
Targets should be challenging but achievable.
Define Priority Clearly
Do not allow every requester to mark a ticket critical without validation.
Automate SLA Tracking
Use timers, alerts, and escalation rules rather than manual monitoring.
Track Response and Resolution Separately
A fast first response does not guarantee timely resolution.
Monitor Aging Tickets
Review old tickets regularly before they become serious service failures.
Measure First Contact Resolution
Resolving issues at the first interaction improves efficiency and user experience.
Review Reopened Tickets
Reopened requests provide insight into resolution quality.
Use Root Cause Analysis
Investigate repeated incidents, breaches, and backlog categories.
Combine Metrics with User Feedback
Numerical performance should be reviewed alongside requester comments.
Review KPIs Regularly
Metrics that were useful last year may no longer reflect current business needs.
Avoid Rewarding Speed Alone
Quality, communication, and user outcome should remain important.
Create Action Plans
Every performance review should result in specific improvements.
Improving Helpdesk Turnaround Time
Reducing TAT requires more than asking agents to work faster.
Improve Ticket Quality
Use structured forms to capture complete information at the beginning.
Automate Assignment
Route tickets to the right agent immediately.
Build a Knowledge Base
Give agents and users access to proven solutions.
Standardize Common Workflows
Create templates for frequent requests.
Reduce Approval Delays
Simplify or automate approval steps.
Improve Agent Training
Develop technical, communication, and process skills.
Link Tickets with Assets
Provide agents with device, equipment, warranty, and service history.
Use Escalation Rules
Escalate blocked or high-risk tickets before deadlines are missed.
Review Repeat Issues
Eliminate root causes that generate unnecessary ticket volume.
Balance Workloads
Distribute tickets according to capacity and skill.
How Helpdesk Software Supports SLA Management
Helpdesk software helps organizations automate service-level monitoring.
Key capabilities may include:
- Multiple SLA policies
- Priority-based targets
- Business-hour calendars
- Holiday calendars
- Response timers
- Resolution timers
- Pause rules
- Escalation alerts
- Breach notifications
- SLA dashboards
- Historical reporting
- Customer-specific agreements
- Service-specific targets
- Multi-location support
The system should make SLA status visible to agents before a breach occurs.
How Helpdesk Software Improves KPI Reporting
A centralized helpdesk platform can automatically record:
- Ticket creation time
- Assignment time
- First response time
- Status changes
- Resolution time
- Closure time
- Reopen events
- Escalations
- Transfers
- Satisfaction feedback
- SLA breaches
This reduces manual reporting and improves data consistency.
Helpdesk Metrics for Internal Support Teams
Internal helpdesks may measure:
- Employee response time
- Internal SLA compliance
- Tickets by department
- Hardware support volume
- Facility request TAT
- Access request completion
- Employee satisfaction
- Repeat equipment issues
- Work order conversion rate
Internal support performance directly affects employee productivity.
Helpdesk Metrics for Customer Support Teams
Customer-facing teams may focus on:
- First response time
- Resolution time
- CSAT
- Customer effort
- Escalation rate
- Repeat contact rate
- Ticket volume by product
- Complaint resolution
- First contact resolution
- SLA by customer contract
Helpdesk Metrics Across Departments
IT Helpdesk
IT teams may track:
- System incident volume
- Password reset requests
- Device issues
- First response time
- Resolution time
- First contact resolution
- System-related repeat tickets
- Asset-linked ticket count
Facilities Helpdesk
Facilities teams may track:
- Repair request TAT
- Maintenance ticket backlog
- Emergency request response
- Work order completion
- Vendor delays
- Repeat facility issues
- Request volume by location
Maintenance Helpdesk
Maintenance teams may track:
- Breakdown ticket response
- Repair turnaround time
- Equipment downtime
- Work order conversion
- Parts-related delays
- Repeat asset failures
- Maintenance SLA compliance
Human Resources Helpdesk
HR teams may track:
- Employee request volume
- Case completion time
- Onboarding request TAT
- Payroll query resolution
- Policy request volume
- Employee satisfaction
Sensitive records should have restricted access.
Procurement Helpdesk
Procurement teams may track:
- Purchase request TAT
- Approval delays
- Vendor query response
- Order status requests
- Sourcing request completion
- Procurement backlog
Industry Use Cases
Manufacturing
Manufacturers may use helpdesk metrics to measure IT issues, equipment requests, maintenance response, facility problems, and production support.
Healthcare
Healthcare organizations may track device support, facility requests, IT incidents, access issues, and internal service performance.
Education
Schools and colleges may measure classroom technology support, campus maintenance, student service requests, and administrative response.
Hospitality
Hotels and restaurants may track guest requests, facility issues, room maintenance, equipment problems, and service turnaround time.
Retail
Retail organizations may measure store support, point-of-sale issues, equipment problems, customer complaints, and location-based performance.
Logistics and Warehousing
Warehouses may track scanner issues, conveyor tickets, facility requests, vehicle support, and operational downtime.
Financial Services
Financial organizations may track application support, access requests, employee services, equipment problems, and contract-based SLA compliance.
How to Implement Helpdesk Metrics and SLA Management
Step 1: Define Service Objectives
Identify what the helpdesk is expected to achieve.
Examples include:
- Faster response
- Reduced backlog
- Better user satisfaction
- Improved SLA compliance
- Lower support cost
- Higher first contact resolution
Step 2: Map the Ticket Lifecycle
Document ticket creation, assignment, response, investigation, resolution, confirmation, and closure.
Step 3: Define Priority Levels
Create clear criteria based on impact and urgency.
Step 4: Define SLA Targets
Set response, resolution, update, and escalation targets.
Step 5: Select Core KPIs
Choose a manageable set of metrics connected to service goals.
Step 6: Standardize Definitions
Document formulas and exclusions.
Step 7: Configure Business Hours
Add shifts, holidays, time zones, and support calendars.
Step 8: Configure Alerts
Notify agents and managers before breaches occur.
Step 9: Create Dashboards
Design operational, management, executive, and agent views.
Step 10: Train the Team
Explain the purpose of each KPI and how data is captured.
Step 11: Review Data Quality
Check for incorrect categories, missing priorities, duplicate tickets, and inaccurate status use.
Step 12: Establish Review Meetings
Review performance weekly, monthly, and quarterly.
Step 13: Create Improvement Actions
Assign owners and due dates for service gaps.
Step 14: Refine Metrics
Update KPIs and targets as services and business priorities change.
Why Choose Asset Infinity for Helpdesk Metrics and SLA Management?
Asset Infinity helps organizations manage support tickets, service commitments, asset-linked requests, and performance reporting from one centralized platform.
With Asset Infinity, businesses can:
- Create and categorize helpdesk tickets
- Define ticket priorities
- Assign requests to agents and teams
- Configure response and resolution targets
- Automate notifications and escalations
- Monitor SLA timers
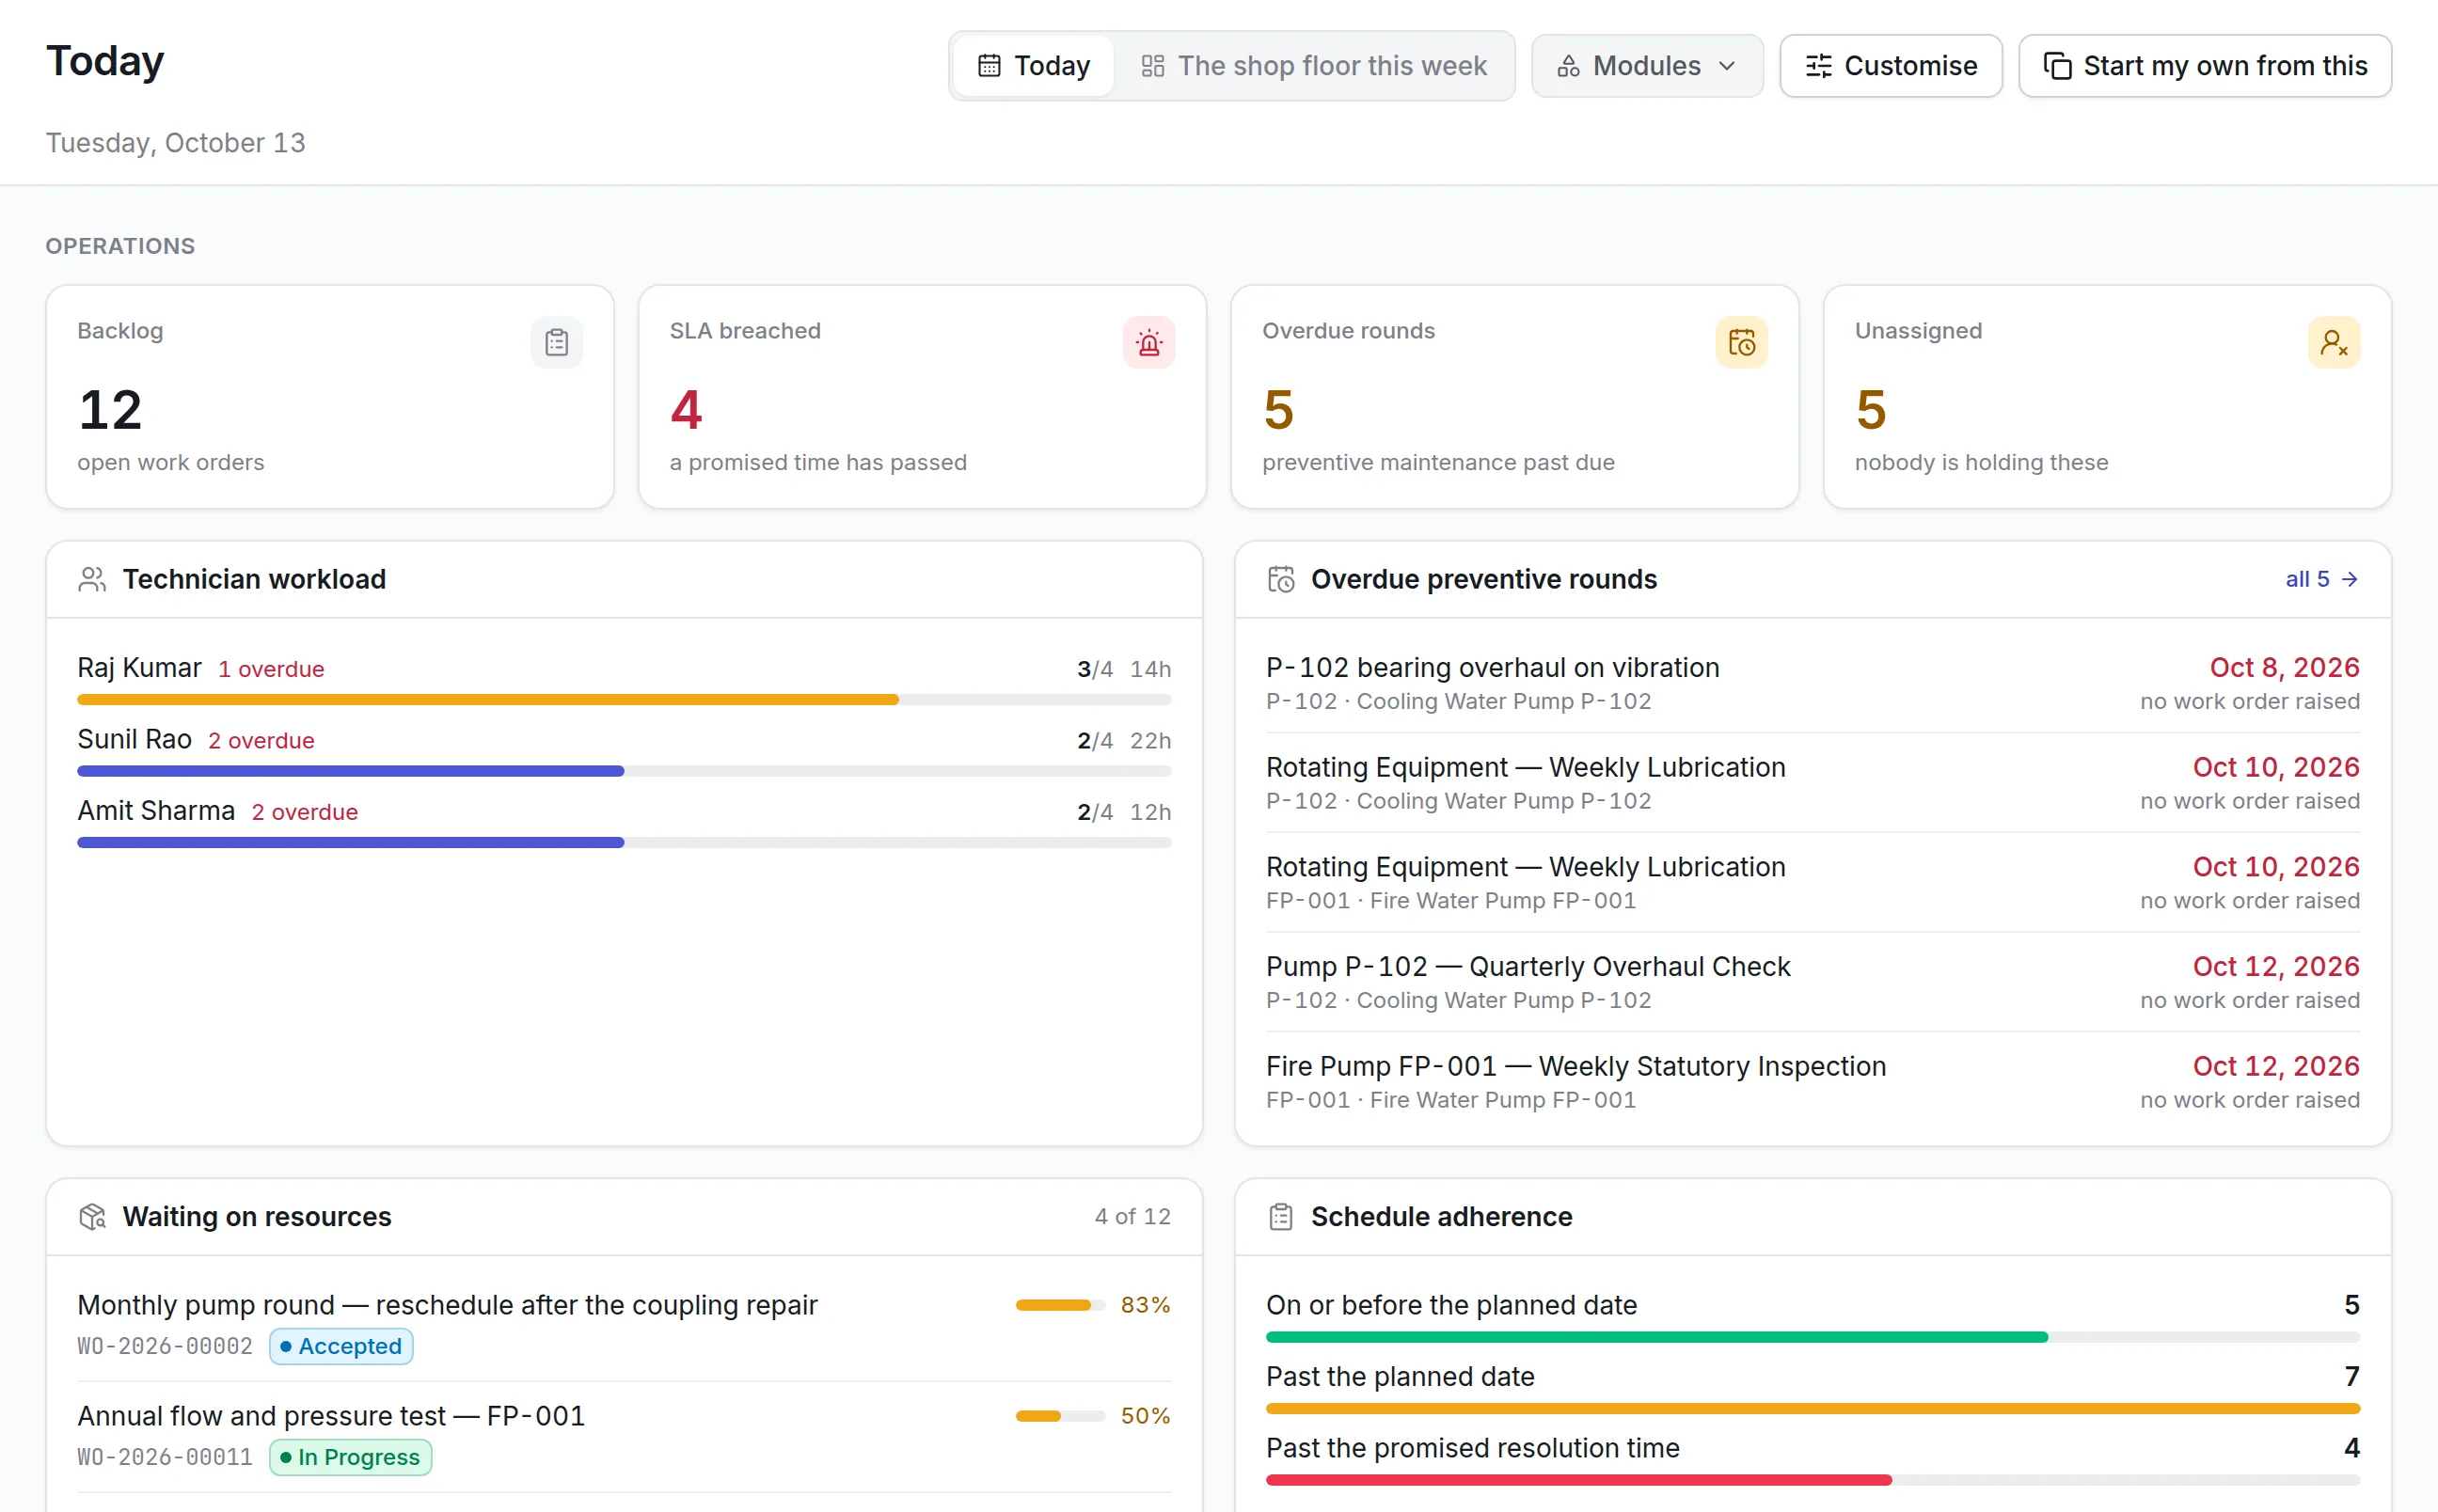
- Track overdue tickets
- View ticket turnaround time
- Measure first response time
- Monitor average resolution time
- Track ticket backlog
- Review ticket aging
- Monitor reopened and escalated tickets
- Link requests with assets and locations
- Convert support tickets into work orders
- Access equipment and maintenance history
- Create operational dashboards
- Compare performance across teams and sites
- Maintain complete ticket histories
- Generate audit-ready reports
- Access tickets through mobile devices
By connecting helpdesk performance with asset, maintenance, and service data, Asset Infinity helps organizations identify recurring problems, reduce service delays, and improve support delivery.
Conclusion
Helpdesk metrics and SLA management provide the visibility organizations need to manage support services effectively.
Metrics such as ticket volume, first response time, resolution time, turnaround time, backlog, reopen rate, first contact resolution, SLA compliance, and customer satisfaction help teams understand both speed and quality.
SLAs create clear service expectations by defining response, resolution, update, and escalation targets. However, service targets must be realistic, measurable, and supported by appropriate staffing and workflows.
Organizations should avoid measuring agents using ticket volume or speed alone. A balanced performance framework should also consider quality, complexity, customer satisfaction, documentation, collaboration, and resolution accuracy.
Helpdesk software such as Asset Infinity automates SLA tracking, records ticket timelines, displays approaching breaches, links requests with assets, and provides real-time dashboards.
With the right metrics, service targets, reporting practices, and improvement processes, organizations can reduce turnaround time, control backlog, improve SLA compliance, strengthen accountability, and deliver more consistent support.
Frequently Asked Questions
1. What are the most important helpdesk metrics?
Important helpdesk metrics include ticket volume, first response time, average resolution time, turnaround time, first contact resolution, SLA compliance, ticket backlog, reopen rate, escalation rate, and customer satisfaction.
2. What is TAT in helpdesk management?
TAT, or turnaround time, is the total time taken to complete a ticket or service request from creation through resolution or closure.
3. What is SLA compliance in a helpdesk?
SLA compliance measures the percentage of eligible tickets that meet defined response, resolution, update, or closure targets.
4. How can a helpdesk reduce SLA breaches?
A helpdesk can reduce breaches by improving assignment, defining clear priorities, balancing workloads, automating alerts, monitoring aging tickets, improving agent skills, and escalating blocked requests early.
5. How does Asset Infinity support helpdesk reporting?
Asset Infinity helps track ticket response, resolution, TAT, SLA compliance, backlog, aging, escalations, reopened tickets, asset-related issues, and team performance through centralized dashboards and reports.